I have previously discussed the widening of the M25 motorway between Junctions 23 and 27, where the economic benefits forecast did not materialise. Another example has now arisen.

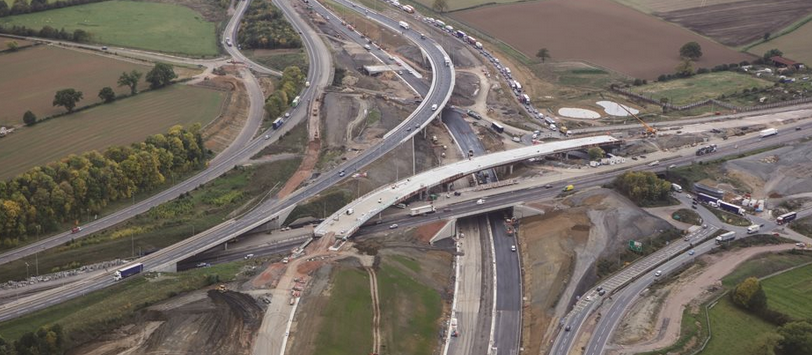
Conversion of the hard shoulder of the J10-13 section of the M1 motorway to dynamic running was intended to reduce congestion by allowing the hard shoulder to be used as an additional running lane during busy periods. The scheme, one of the earlier ‘smart motorways’, opened in 2012 and a report of its first five years of operation, up to 2017, was published in 2021. The cost was £489m for 15 miles of widened motorway, adjacent to Luton, to the north of London.

Electronic signs tell drivers when it is safe to use the hard shoulder as a running lane, but then speeds are limited by the level of congestion, with a maximum of 60mph. This, together with some traffic growth on the route, meant that journey times were in fact longer than before the road was converted.

The main economic benefit of road investments is taken to be travel time savings. In the present case, the forecast had been for an average travel time savings of 1.5 min per vehicle in the opening year, increasing to 2.25 min by 2028. But time savings were not observed. The forecast benefit-cost ratio (BCR) had been 1.4, whereas the estimate based on the five-year outturn was negative, -0.8.

The stated conclusion, five years after opening, was: ‘In this case, the monetisation of journey time benefit is not a good measure of value for money and the qualitative evidence presented in the evaluation is considered a more robust measure.’ The failure of forecasting was attributed to limited prior experience of such smart motorway conversions.

In view of this marked discrepancy between forecast and outturn, I made a Freedom-of-Information request to see the detailed reports of the traffic modelling and economic analysis of the proposed investment. The original modelling had been for a widening from three to four standard lanes in each direction. The model was adapted for the use of the hard shoulder for the extra lane. The model drew upon the East of England Regional Model, a variable demand model, for data to input to a local traffic model for the section of the M1 involved. As elsewhere, the traffic modelling employed the established SATURN package.

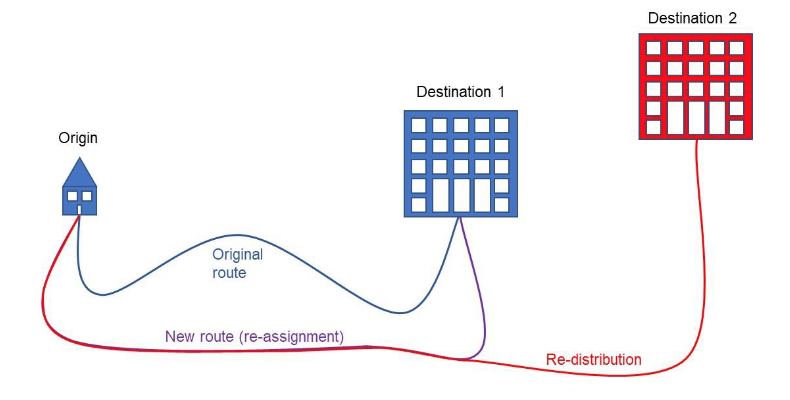
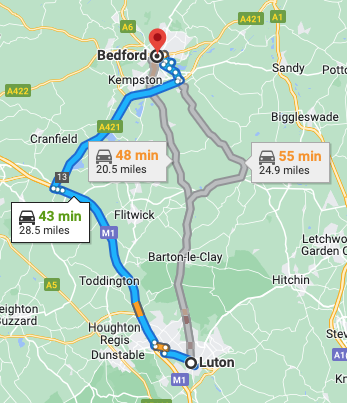
The traffic modelling projected increased traffic volumes, comparing the investment case with the ‘do minimum’ case without the investment, as well as journey time reductions in the range 4-15% for the opening year, depending on section of the road and time of day. The economic appraisal used the output of the traffic model as input to the standard TUBA economic model to project the economic benefits. The main benefits were time savings to business users of £456m pv, offset by increased vehicle operating costs (VOC) of £61m. There were time savings to consumers of £170m, more than offset by increased VOC of £197m. This suggests that the increased road capacity is attracting local users, such as commuters, who save a few minutes of their journey by rerouting to the motorway, at the cost of more fuel use for a longer trip, as illustrated in the screenshot from Google Maps above. A similar situation arose in the M25 case.

The forecast BCR from the TUBA model was 3.5, which is different from the forecast of 1.4 provided in the year five report (above), apparently on account of a change in how increases in revenue from fuel taxation are required to be treated, whether as offsetting the scheme costs or as an element of the benefits from the investment.

Conclusion

Transport models are complex and opaque. Generally, little effort is made to valid forecast against outturn. The present M1 case demonstrates a marked failure of a model to forecast the observed traffic flows and speeds five years after opening.

More generally, monitoring traffic flows and speeds provides only limited information about the validity of a model that projects economic benefits for different classes of road user. The outturn of a widening scheme that matched projected flows might arise if all the increase in traffic volumes arose from more local users taking advantage of the increased capacity to save time on local trips, thereby pre-empting benefits to long distance business users. Effective monitoring needs to track the travel behaviour of different classes of road users.

It seems likely that there is often a bias in traffic modelling of road investments to underestimate the growth of local traffic and hence to overstate the economic benefits to business users.

The Office of Rail and Road has extensive responsibilities for regulating the largely private sector rail industry but quite limited oversight of public sectors roads. The Department for Transport is planning its third Road Investment Strategy investment programme (RIS3). The ORR has been consulting on its role in relation to RIS3. Essentially, the ORR sees its role as ensuring that National Highways (formerly Highways England) achieve value for money in implementing the DfT’s investment priorities.

The ORR consultation document states that it is not the role of the ORR to set roads policy or determine investment priorities. However, it is a shortcoming of the ORR’s approach that it does not consider to what extent the investments agreed by government achieve the benefits to road users that are expected. This is a major gap in public oversight.

The National Audit Office from time to time evaluates benefits to users of road investment, for instance its 2019 report on improvements to the A303. But NAO oversight is occasional, not systematic.

Detailed analysis of the outcomes of road investment may show major discrepancy between forecast and outturn, for instance for widening the M25 between junctions 23 and 27. One general explanation is the underestimation of the scale of induced traffic . Induced traffic reduces travel time savings, supposed main economic benefits of investment, which is why transport models tend to underestimate its magnitude.

One source of induced traffic is the rerouting of local trips, such as commuting, to take advantage of faster travel on widened motorways, pre-empting capacity intended for business users and so undermining the economic case for widening. This is likely to be a general phenomenon in or near areas of high population density, where the strategic road network comes under greatest stress, and where the case for additional capacity seems strongest.

More generally, average travel time, as determined in the National Travel Survey, has remained essentially unchanged for half a century, during which time huge sums have been invested in road infrastructure justified by the saving of travel time. Travel time savings are short-run. In the longer run, over the greater part of the life of the assets, the main benefit of investment that allows faster travel takes the form of increased access to people and places, opportunities and choices.

All in all, there is reason to suppose that the outcomes of road investments may be substantially different from that forecast by the traffic and economic models in use, and that road users are not benefiting from investment in new capacity to the extent intended. The ORR should take on the task of ensuring that road investment appraisal methodologies are fit for purpose.

In my previous blog I outlined the economic thinking behind the Government’s Integrated Rail Plan for the North and Midlands. This was based on an approach developed by the National Infrastructure Commission (NIC) that put values on the benefits to both businesses and consumers of improving transport to achieve higher density city centres. For businesses, what are known as agglomeration benefits arise from improved opportunities to share facilities and suppliers, better matching between employers and employees, and more learning that fosters innovation. For consumers, there are analogous benefits from improved opportunities for consumption of material goods and cultural services, as well as for social interactions.

Economic appraisal of transport infrastructure investment based on these real-world observable benefits is more relevant to decision makers than is orthodox analysis based on theoretical ‘generalised costs’, which lumps together time costs and money costs and then disregards the awkward finding that average travel time has not changed for at least half a century. Importantly, the NIC approach addresses the benefits from programmes of investment, not of individual schemes, which is also more useful to decision makers responsible for major capital expenditure programmes.

The question is whether the NIC approach might usefully be applied to road investment. After all, the strategic purposes of road and rail investment are not fundamentally different, although there are differences in application. Crucially, rail investment can move more people into city centres where road capacity cannot be increased, and indeed is commonly being decreased to create more space for buses, active travel and pedestrians.

Investment in new road capacity is therefore generally beyond cities, intended to reduce road traffic congestion and to foster connectivity between cities for mutual economic benefit. However, induced traffic arising from new capacity tends to restore congestion to what it had been, reducing predicted economic benefits. Besides, the standard approach to economic appraisal addresses the benefits of individual schemes, not the benefits from a programme of improvements as a whole. The National Audit Office reported in 2019 on the DfT’s plan to construct a tunnel adjacent to Stonehenge, drawing attention to the lack of a plan for the A303 corridor as a whole. This includes 35 miles of single carriageway, with eight improvements intended, seven of which, considered individually, have low or poor benefit-cost ratios. The question is whether investment in the whole corridor is greater than the sum of the parts. To answer this, appraisal at strategic level is needed.

The DfT’s road investment strategy is now being developed for a third five-year programme, to follow the current £27 billion 2020-2025 RIS2 programme. This requires a view of the economic benefits of the programme as a whole, as happened for the Integrated Rail Plan. We need to address the real observable economic benefits of road investment, particularly important given that new road capacity leads to more traffic and so more carbon emissions, at a time when we are committed a rapid reduction on transport’s contribution to climate change.

The NIC has started work on its second National Infrastructure Assessment. For this purpose, it is developing a high-level approach for future investment, including a framework for decision making and prioritisation for interurban transport improvements across the modes.

Another strategic multi-modal transport investment programme whose economic case needs to be considered arises from the Union Connectivity Review, chaired by Sir Peter Hendy, published in November, and intended to improve connectivity between the nations of the United Kingdom. This concluded that while devolution has been good for development of transport within regions, cross-border schemes have tended to be of lower priority. The Review made a number of specific recommendations, including investing in the West Coast Mainline north of Crewe to achieve better interconnectivity between England and Scotland by means of HS2, and endorsing the Welsh Government’s multi-modal approach to dealing with congestion on the M4. However, the economic content of the Review was minimal.

The Union Connectivity Review recognised that domestic aviation is important for Northern Ireland and the more northern regions of Scotland. Some services receive subsidy from government through ‘public service obligation’ arrangements. Contrarywise, fares have been higher because Air Passenger Duty has been imposed on both the outbound and inward legs of domestic flights. However, the government has announced that the duty will be halved for domestic flights from 2023.

Air travel is of concern on account of its contribution to global warming. Journeys between London and Glasgow by plane produce more than five times more greenhouse gas emissions per passenger than the equivalent journey by rail. However, much effort in underway to develop sustainable aviation fuels for existing aircraft and electric propulsion for new models. If these developments succeed, domestic air travel may become economically attractive, with its limited requirement for airport and air traffic control infrastructure, in contrast to road and rail travel with carriageway and track requiring maintenance over the whole route.

Besides Union Connectivity, we are expecting the government to articulate its approach to ‘levelling up’, which will doubtless make reference to transport investment. Given the range of developments of transport infrastructure that are being contemplated, fresh thinking is needed to identify and value the benefits in ways that facilitate good decisions. The DfT’s Transport Analysis Guidance is no longer fit for purpose.

This blog was the basis for an article that appeared in Local Transport Today of 28 January 2022.

The Government published its Integrated Rail Plan for the North and Midlands (IRP) in November. Despite headline investment worth £96bn, public reception was mostly unfavourable. Expectations had been excessively raised. Cities that failed to gain hoped for improved services and new stations spoke up more loudly than the winners of this apparent lottery. Huw Merriman MP, chair of the Commons Transport Committee, put well ‘the danger in selling perpetual sunlight and then leaving it for others to explain the arrival of moonlight.’

What has not previously been remarked is the absence of any supporting economic analysis to justify the investment choices of the IRP. This is in marked contrast to the succession of documents justifying HS2, with benefit-cost ratios that declined over time as the capital costs steadily rose. One problem with applying the DfT’s standard approach to economic appraisal, for which the main benefit is travel time saving, is that it is silent on the distribution of economic benefits, a serious disadvantage for a project whose strategic purpose is to boost the economies of the cities of the North and Midlands.

The DfT has at long last recognised the problematic nature of theoretical time savings. The IRP states: ‘Over the last 50 years the time people spend travelling has remained relatively constant, though distances travelled have increased…. Overall, people have taken the benefits of better transport links as the ability to access a wider range of jobs, business and leisure opportunities, rather than to reduce total time spent travelling.’ (para 2.8)  

It is gratifying to find the DfT seemingly accepting an understanding of this reality, to which I have been drawing attention for many years. Nevetheless, there is a footnote appended that suggests the Department doesn’t yet quite get it: ‘Noting that the use of estimated time savings as the basis for quantifying economic impact remains robust.’

If time savings are a ‘robust’ measure of economic impact, why was the standard cost-benefit approach to investment appraisal not employed? The answer, as the IRP recognises, is that ‘rail schemes in the North are at increased risk of being considered poor value for money when applying conventional cost-benefit analysis. This is driven in part by smaller city populations in the North, different travel patterns, as well as the general high cost of building rail infrastructure.’ (para 3.59). So conventional cost-benefit analysis, as prescribed in the thousand-pages of the DfT’s Transport Analysis Guidance (TAG), is not fit for the purpose of appraising rail investments. The main problems are the absence of observed time savings in the long run, silence on the spatial distribution of benefits and on the value of consequential property development and economic regeneration.

In developing the IRP, the Government has been guided by the analysis of rail investment options carried out by the National Infrastructure Commission (NIC), which concluded that prioritising regional links appears to have the highest potential economic benefits overall for cities in the Midlands and the North and would improve many of the currently poorest services. Improving East-West links are higher priority than North-South routes. The Government agrees with the NIC’s analysis that there are opportunities to better serve existing city centres and wider city regions for greater economic benefit, and better integration with existing transport networks. Given constraints on public expenditure, the eastern leg of HS2 between the East Midlands and Leeds will not now go ahead.

To reach its conclusions, the NIC developed a novel multi-criteria analytical approach that attributed monetary values to improvements in productivity in city centres, benefits from connecting people to city centres, and environmental impacts. In addition, estimates were made of improvements to connectivity from faster journeys and of the benefits from unlocking investment in land around stations. In essence, this approach replaces traditional transport user benefits, which mainly take the form of a reduction in time costs, with estimates of the benefits of increased productivity and consumer amenity arising from higher city densities made possible by urban transport investment.

The NIC analytical approach was developed for consideration of a portfolio of rail investments. This is very welcome since there is an undoubted need to move beyond appraisal of individual schemes to view the benefits of whole programmes of infrastructure investments. In a subsequent blog, I will consider the applicability of this approach to road investments.

This blog was the basis for an article in Local Transport Today of 14 January 2022.

Induced traffic is the additional traffic that arises from investment to increase road capacity. The usual reason to increase capacity is to relieve congestion. The intended outcome is that journeys are faster and easier. Yet this can lead to more frequent or longer car trips, changes to route or destination, or mode switching from public transport. All these changes lead to more traffic on the network.

The problem with induced traffic is that the more of it there is, the less the savings in travel time, which are treated as the main economic benefit of investment. So, the magnitude of induced traffic is of interest, prompting the Department of Transport to commission a study by consultants WSP and RAND Europe of options to improve its measurement. Two broad approaches were identified: econometric analysis that quantifies the relation between road capacity changes and observed traffic levels over time; and Before and After (B&A) studies that compare traffic before and after particular interventions.

The disadvantage of the econometric approach is that it generates an aggregate measure that does not indicate the components of induced traffic. B&A studies are more illuminating and could be improved by use of mobile phone network data (MND) to quantify changes to travel behaviour. MND allows an understanding of origins and destinations of trips, before and after an intervention. Large samples of road users are available, which would enable distinction to be made between the various kinds of change in travel behaviour. Transport for London has developed a multi-modal strategic transport model that estimates demand from MND.

One possibility not considered in the WSP/RAND study would be to carry out a sample survey of users of the road network, before and after an intervention, identifying changes in travel behaviour over time. This could employ seven-day travel diaries as for the National Travel Survey, or GPS to track travel patterns via a smartphone app. Studies of this kind, known as longitudinal studies, are well established in medicine and the social sciences. Much current research into the impact of Covid-19 is longitudinal, for instance following the immune response to vaccination over time. However, longitudinal studies of travel behaviour are rare, although they have the potential to understand the impact of investments in far more illuminating detail than is possible with conventional before and after traffic counts. 

The WSP/RAND study concludes that all components of induced travel can be represented in the standard four-stage transport model, except that arising from changes to land use, which may have a substantial impact. However, the study did not consider the implications of induced traffic for the economic analysis of road investments, which routinely employs the output of a traffic model (including induced traffic effects) as input to an economic model. This is usually the DfT’s TUBA model, which generates monetary values of the time savings and other benefits/disbenefits. The net present value of the benefits is then compared with the investment costs to yield a benefit-cost ratio, important for investment decisions.

The phenomenon of induced traffic was recognised in a landmark 1994 report by the Standing Advisory Committee on Trunk Road Assessment (SACTRA). It is remarkable how little progress has been made in understanding its origins and incorporating this into modelling and economic appraisal. A cynic might say that this is because induced traffic undercuts the economic case for a road investment where the main benefit is supposed to be travel time savings, and so is yet a further headwind for the DfT’s £27 billion road investment programme. My own analysis of the widening of the M25 J23-27 showed that induced traffic, largely arising from rerouted local trips, was substantially greater than forecast and wiped out the economic benefits expected to accrue to longer distance business users. This is likely to be typical of investment to add capacity near densely populated urban areas where local commuters and others compete for road space with long distance business users. Standard traffic models are biased against fully recognising induced traffic.

The concept of induced traffic as an aggregate measure is now obsolete. Instead, we need to focus on how travel behaviour actually changes as the result of an intervention, and then work out how to value those behaviour changes. If an investment allows travel time to be saved, then monetary value can be ascribed according to established methods. However, we lack methodology for valuing longer trips to more distant destinations, motivated by the greater value of access to goods or services. Increased access is the real benefit of transport investment.

The above blog post was the basis for an article in Local Transport Today 836, 16 December 2021.

Inrix, a firm that analyses road traffic, recently reported average delays in London due to congestion in 2021 of 148 hours, twice the national average, but virtually the same as in 2019, before the pandemic. This prompted debate about the impact of the increase in cycle lanes put in place in London in response to Covid-19.

To make sense of what is happening, we need to recognise that our availability of time always constrains the amount we can travel. There are many activities that we need to fit into the 24 hours of the day, and on average we spend just an hour on the move. This limits the build-up of congestion.

Road traffic congestion arises in areas of high population density and high car ownership where is not enough road space for all the car trips that might be made. If traffic volumes grow for any reason, delays increase and some potential car users make other choices. We may change the timing or route of a car journey, or the travel mode where there are alternatives available, or a different destination such as an alternative shopping centre, or not to travel at all, for instance by shopping online.

So, if road space is taken away from cars in order to create cycle or bus lanes, then initially congestion will increase. But the additional delays will induce some car drivers to make alternative choices and congestion will revert to what it had been. The overall impact is to reduce the share of trips by car, which is what has been happening in London for many years as the population has grown and as there has been large investment in public transport, with less road space for cars: private transport use fell from 48% in 2000 to 37% in 2019, while public transport use grew from 27% to 36% over the same period. Cycling increased from 1.2% to 2.4% while walking held steady at 25%.

The London Mayor’s transport strategy ambitiously aims to cut private transport use to 20% of all trips by 2041. This would be expected to diminish the total amount of traffic congestion, although not necessarily its intensity at peak times in the busiest areas.

Creating cycles lanes reduces the space available for cars but in itself it does not get people out of their cars. Copenhagen is a city famous for cycling, with 28% of journeys made by bike. Yet car traffic is only slightly less than in London. Aside from cycling, the other big difference is that public transport accounts for only half the proportion of trips compared with London.

The experience of Copenhagen indicates that we can get people off buses onto bikes, which are cheaper, healthier, better for the environment and no slower in congested traffic. Yet buses are an efficient way of using road space to move people in urban areas, with diesel engines being replaced by electric or hydrogen propulsion to cut carbon emissions. We would like to get drivers out of their cars onto bicycles, yet this has proved difficult, even in Copenhagen, a small flat city with excellent cycling infrastructure and a strong cycling culture.

Looking across a range of European cities, we find very diverse patterns of journeys by the different travel modes, reflecting, history, geography, size and population density. But we do not find cities with high levels of both cycling and public transport. So, the prospects for a substantial increase in cycling in London are far from certain, given the relatively high level of past public transport use.

The pandemic has had a major impact on public transport use in London, with bus and Tube journeys currently at only 70-75% of pre-pandemic levels. The financial consequences have been severe. Transport for London may have to embark upon a ‘managed decline’ scenario unless more support from the government is forthcoming.

In such circumstances, further investment in new rail routes would not be possible and existing services would be reduced. Investment in cycling would then be the most attractive way of implementing the strategy of reducing car use in London, both by encouraging cycling as an alternative and by lessening the scope for people to drive.

The above blog post was the basis for an article in The Conversation on 9 December 2021.

The switch to electric vehicles (EVs) will result in the loss of revenue from road fuel duty, as is generally recognised. This prompts the question of whether to replace fuel duty with a charge for use of the roads, as many have suggested. This issue was ducked in the recent Transport Decarbonisation Plan from the Department for Transport, but it won’t go away.

The general replacement of road fuel duty, collected from the oil companies, by a charge collected from many millions of road users, would be a formidable undertaking. My suggestion is that this happens in stages.

First, it should only be EVs that pay a road user charge, the rationale being that they need to contribute to the costs of maintaining and operating the road network in the way that drivers of conventional vehicles do via fuel duty. But while the capital costs of EVs are higher than those for comparable internal combustion engine vehicles, it would be necessary to retain lower untaxed running costs to incentive uptake. However, it is expected that the purchase prices of EVs will fall as battery costs continue to decline. Road user charging for EVs could be introduced once purchase prices of EVs and conventional vehicles are similar.

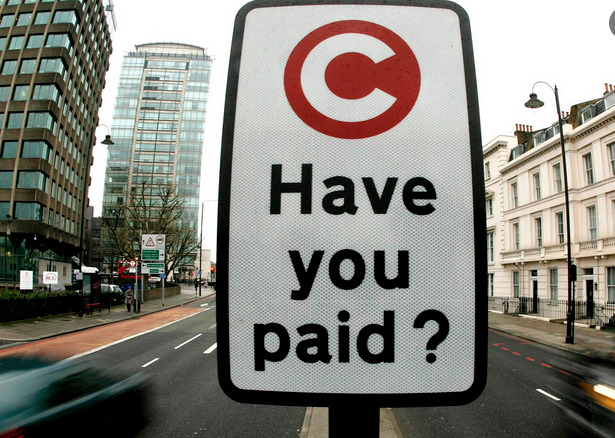
Second, it would be sensible to stage the adoption of road user charging spatially by starting in London. The congestion charge in London has been operating successfully for nearly twenty years. The technology works, useful revenues are generated to support public transport, and the system is publicly acceptable, with no significant concerns about privacy despite the ubiquity of enforcement cameras. The technology has been used to charge older polluting vehicles, initially in the congestion charging zone, and subsequently within the area bounded by the North and South Circular Roads.

The London congestion charge system levies a daily charge on entry to the charging zone, subject to a variety of exclusions. A more flexible system would be needed for EV user charging. The first step might be to migrate the charging mechanism to a smartphone app, which knows where it is in time and space and so knows if it is subject to user charging. The app would need to know in which vehicle it is located since enforcement of the charging system depends on automatic number plate recognition by fixed cameras.

The incentive for users to migrate to their smartphones would be a reduced daily charge, compared with the present £15. Then it would be possible to flex the charge, for instance to reflect duration in the charging zone, or whether at times of peak use or location within the zone. Such flexing should be publicly acceptable if charges never exceed the standard daily charge. Experience would be gained of how road users respond to varying charges. The congestion charging could be extended beyond the present central zone if that seemed useful to manage traffic and was publicly acceptable.

Once a flexible charging scheme had been proven in London, it could be adopted by other cities that wished to manage traffic and raise revenue to fund public transport and active travel, subject to electorates being willing. Once the charging scheme had been adopted by a number of cities for the generality of motorised vehicles, it could be extended nationally to EVs. Charges would then have two elements: that levied by the local road authority and that levied by central government. There would be scope for local authorities to vary charges to meet local needs, for instance to generate more revenue to fix potholes, or, more ambitiously, to deter car use in town centres and subsidise public transport. More generally, an appropriate apportionment of road user charging between local and national government would facilitate devolution of responsibilities for transport to localities.

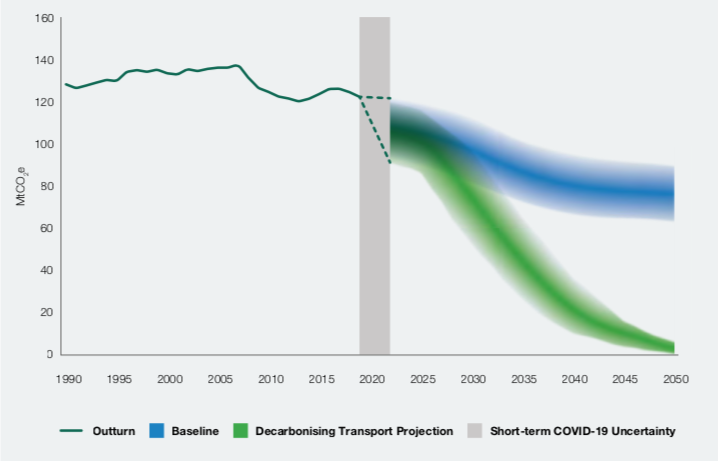
The Department for Transport’s Decarbonisation Plan projects the decline of domestic transport greenhouse gas emissions from the present 120 MtCO2e a year to approaching zero by 2050 (see figure above). There is considerable initial uncertainty about the pathway but the range of projected outcomes narrows over time as the proportion of zero emission vehicles increases. The modelling is largely based on the Department’s long-established National Transport Model. Although little detail is provided, there are headline numbers for cumulative emission reductions over the period 2020 to 2050.

For cycling and walking, the projected savings from investments and policy initiatives are put at 1-6 MtCO2e, a notably wide range. For cars and vans, the savings are estimated to be 620-850 MtCO2e, a proportionately narrower range, reflecting greater confidence in the impact of policy to phase out the internal combustion engine. What is striking is the relatively tiny decarbonisation contribution expected from increases in active travel, at best one percent of that from car decarbonisation. This is surprising, given the prominence in the Plan of the intention to promote active travel, including expenditure of £2 billion over five years. This looks like a case of virtue signalling by DfT, wanting to be on the side of the angels.

Counting on minimal decarbonisation benefit from more cycling is consistent with the evidence from Copenhagen and other European cities that you can get people off the buses onto bikes but that it is difficult to get them out of their cars. In any event, 80% of car carbon emissions arise from trips of more than five miles, implying limited scope for savings from mode switching from car to active travel.

More generally, the DfT’s Plan relies very largely on technological innovation to achieve net zero for domestic transport by 2050. Others see a need for significant reduction in travel demand, including the Climate Change Committee (CCC) in its Sixth Carbon Budget report of December 2020, which envisages 20% of transport emission reductions from reduced demand. The CCC recommended commitment to 78% reduction in overall emissions by 2035 compared with 1990 levels. This was accepted by the government and is to be implemented through sector plans, of which the Transport Decarbonisation Plan is the first. 

The question of the need for travel demand reduction is crucial, given this could be both unpopular and difficult to achieve. One can see why the DfT might shy away from measures to reduce demand, such as significant increases in the cost of travel. But aside from the political sensitivities, could such measures be justified on the basis of existing models that generate conflicting conclusions and whose validity is unproven?

The National Transport Model is an elaborate model of the surface transport sector. Other relevant models are essentially energy models of the whole economy, including the transport sector. All these models are complex and opaque, with many parameters whose magnitude requires professional judgement. Given the timescale to 2050, it is not possible to validate models by comparing forecast with outturn. Models are therefore prone to optimism bias, whether unconsciously because modellers want to please their clients, or consciously in aid of achieving some higher purpose.

Greater transparency of the National Transport Model would allow us to understand whether there has been undue optimism about the prospects for decarbonisation by technology. However, such transparency seems unlikely. The DfT has always resisted allowing others to use its model on the grounds that its components employ proprietary software developed by consultants. Not that this is unique. Most transport modelling utilises proprietary models owned by consultants. This contrasts with practice elsewhere.

The Treasury’s model of the UK economy has been available for external use for many years. The Department for Business, Energy and Industrial Strategy has developed its energy modelling in close collaboration with academia and plans to increase transparency. Climate modelling is an international, open, collaborative effort that feeds into the findings of the Intergovernmental Panel on Climate Change. The epidemiological modelling of the coronavirus pandemic, which has informed decisions on lockdowns and vaccine deployment, has been carried out not within government, but by university modellers, collaboratively and transparently.

Transport modelling needs to move on, to become transparent and collaborative rather than opaque and proprietary. More effort needs to be devoted to validating models by comparing forecast with outturn where that is possible, for instance over the initial years following the opening of a new element of infrastructure. For the period through to 2050, the best that can be done is for modellers to run their models on common assumptions, to understand why forecasts differ, and then to vary assumptions to test the sensitivity of forecasts to bias, both optimism and pessimism, whether concerning technological innovations or behavioural change.

We need an informed consensus from the modellers of transport decarbonisation to inform the development of policy.

The text above was published in Local Transport Today edition of 18 October 2021. Since this piece was drafted, two further relevant publications have become available.

CREDS, the Centre for Research into Energy Demand Solutions, a consortium of university groups, published a substantial report on the role of energy demand reduction in achieving net zero, including the energy associated with the transport system. The report concluded that the UK could halve its demand for energy by 2050, which would substantially ease the task of meeting that demand with zero carbon emissions. For transport, an ambitious set of assumptions were made, including that single occupancy car use becomes socially unacceptable and that the car fleet is reduced substantially. The model employed represents the whole energy system and is known as UK-TIMES. The model and assumptions are set out in some detail and the code has been published, which is very creditable, although it would take a professional modeller to fully appreciate the content.

The government has just published its Net Zero Strategy. This covers the whole economy including transport, although little is added to the previously published Transport Decarbonisation Plan, which placed minimal reliance on changes in travel behaviour. A technical annex sets out the modelling and assumptions used to justify the pathway to net zero by 2050, again employing the UK-TIMES model. For transport, the only behavioural change assumed is that the share of journeys in towns by active travel increases from 42% in 2019 to 55% in 2035. The trajectory of emission reduction for domestic transport on page 154 is similar to that shown in the Department for Transport decarbonisation plan, although the modelling framework used is different.

It is evident that the emission consequences of a wide range of travel behavioural change possibilities are being projected using different kinds of model. The recent publications reinforce the case for transparency and collaboration amongst the modellers.

A further addendum, November 2021

DfT has recently published papers about its new version of the National Transport Model, which is based on standard industry software and is intended to be available for use outside the Department. This is a welcome development that will make the model more transparent, although its complexity means that it is still quite opaque. However, the carbon modelling discussed above was derived form the older version of the NTM.

The research literature – papers on aspects of travel and transport in peer-reviewed journals – has burgeoned in recent years. There are more papers in established journals and new journals created, often on an open access basis whereby the researchers pay the cost of publication, rather than journals relying on Libraries taking out subscriptions. The commercial basis of these new open access journals is not always clear, but certainly some are operated by for-profit publishers. There may therefore be an incentive to relax standards in the peer-review process to generate more income, lessening the overall quality of the research literature, which accords with my subjective impression. Some of the not-for-profit open access journals appear to lack editorial oversight by academic researchers.

One feature of many recent publications is the theoretical modelling of a new technology. This may be useful where there is a clear practical need, for instance the optimal deployment of charging points for electric vehicles. Yet there is also extensive modelling activity in relation to the deployment of autonomous vehicles (AVs), where experience of on-road behaviour is extremely limited thus far. Because model outputs depend on assumptions about AV performance parameters, the conclusions of such studies are very varied and provide little in the way of useful guidance to practitioners and policy makers.

Another feature of the literature is the excessive formal analysis of survey findings, for instance of the responses to surveys of the expected impact of a new technology, such as AVs, whether of drivers or city planners. State of the art analysis is reported in tabular form, with statistical significance specified numerically. Rarely are findings reported as charts, bar charts or scatter diagrams, with uncertainty shown visually, which would make clear the common limited significance of the findings.

A further feature of the recent literature is the systematic review, in which formal search methodologies are employed to identify all relevant papers on a topic. One problem is that because of the deteriorating quality of the literature, it becomes difficult to see the wood for the trees, as every paper needs to be cited. Systematic review originated in the medical literature where the aim of such meta-analysis is to identify every relevant study of a condition or treatment, with a ranking by quality such that only the highest quality papers contribute to the conclusions of the review. But for transport studies, such quality ranking is not practical, in part because findings may be specific to particular locations or circumstances.

Another problem with formal searching of the literature is that relevant papers may be missed because of the difficulty of specifying appropriate search terms. A recent paper by a distinguished transport researcher addressed a topic on which I had published some years ago without mentioning my contribution. When I raised the matter, I received an apology that his search had failed to identify my papers.

I have noticed increasing reference in the recent literature to transport researchers as ‘scholars’, a term hitherto largely reserved for those working in the humanities. Generally, those involved in transport research have seen themselves as based in disciplines such as engineering, economics, planning and the environmental sciences. The purpose of research within such disciplinary frameworks has been to advance understanding and thereby contribute to practical solutions to the problems of the transport sector. We have not, I think, seen ourselves as primarily involved in developing a branch of knowledge through scholarship that focuses on the extant literature. Indeed, the inward-looking processes of scholarship are cluttering up the literature with findings of little use and thereby may be displacing contributions of more practical value.

For instance, I have been attempting, without success, to get published in a peer-reviewed journal a paper on Digital Navigation, by which I mean the combination of satnav, digital mapping and route guidance algorithms that are in widespread use by road users. Highways Magazine, read by practitioners, has published a short account of my analysis, but a fully documented paper seems not to fit the current fashion for what’s hot, as seen by journal editors.

I have an article published in Highways Magazine, the text of which is below.

Recent advances in a number of digital technologies in combination are having a significant impact on travel behaviour on the road network by providing route guidance that takes account of traffic conditions. What may be termed ‘digital navigation’ involves the use of satellite navigation (satnav) to provide spatial positioning to high precision; digital mapping; the ability to detect vehicle speeds and hence the location of traffic congestion; and routing algorithms to optimise journeys. The combination of satnav location and digital mapping provides a navigation service that offers turn-by-turn route guidance.

While digital navigation is in widespread use by road users, remarkably little information is publicly available about performance, in particular how routes are optimised, the suitability of recommended routes, the accuracy of estimated journey times, and the impact on the functioning of the road network as a whole. Nevertheless, there is evidence to indicate an impact on the use of minor roads, of major roads, and on traffic congestion and the optimisation of the road network.

Recent revisions to British road traffic statistics appear to show that there has been a substantial growth of motor vehicle traffic on minor roads in recent years, an increase of 26% between 2010 and 2019, while traffic on major roads increased by only 12%.  One factor contributing to this growth is the increase in van traffic, including that arising from the growth of online shopping with home deliveries. However, in 2019 van traffic amounted to 15% of traffic on urban minor roads, and 19% on rural minor roads, cars being responsible for 82% and 78% of traffic respectively. So, the growth of van traffic on minor roads has been responsible for only part of the overall traffic growth on these roads.

The most likely main contribution to the large growth of traffic on minor roads is the widespread use of digital navigation, which makes possible the general use of minor roads that previously were largely confined to those road users with local knowledge, as well as extending such local knowledge. Diversion to minor roads is likely to occur when major roads are congested and represents an effective increase in the capacity of the road network, so generating additional traffic.

As well as encouraging use of minor roads, digital navigation may divert traffic from local roads to roads intended for longer distance traffic. One case that I have analysed where such diversion may have occurred is the widening of the M25, the London orbital motorway, between junctions 23 and 27 to the north of the city. There was substantial growth in traffic above the level that had been forecast, much of which arose from diversion of local trips, such as home to work, to take advantage of faster travel on the motorway, despite the greater distance and higher fuel costs incurred. The contribution of digital navigation in facilitating such diversion cannot be inferred from available data, but it is plausible. Regular users of digital navigation would have up-to-date information for each journey, while irregular or non-users would likely be aware that diversion to the motorway would offer the fastest journey.

The M25 case study suggests that local traffic may be expected to take advantage of the capacity increase of major routes in the vicinity of urban areas that generate much traffic, which are the locations where the Strategic Road Network is under greatest stress and where investments to increase capacity are thought to be most needed. However, this local traffic negates the benefits expected for long distance road users and so undermines the economic case for the investment. The growing use of digital navigation would tend to contribute further to weakening the case for such investment.

While the M25 case study is an illustration of the maxim that we can’t build our way out of road traffic congestion, nevertheless the development of digital navigation offers probably the best means available to mitigate the impact of congestion. Congestion arises in or near areas of high population density and high car ownership, where the capacity of the road network is insufficient to cope with all the trips that might be made. Drivers are deterred by the prospect of time delays and so make other decisions – to travel at a different time, by a different route, by a different mode, to a different destination (where there are options, as for shopping), or not to travel at all (by shopping online, for instance). Congestion is therefore substantially self-regulating, in that if traffic increases, delays worsen and more potential users are deterred on account of the time constraint.

Digital navigation that takes account of congestion in real time can offer less congested routes, so making better use of the existing road network and reducing road users’ exposure to congestion. One problem that may arise is that traffic may be diverted on to unsuitable roads, where local environments and neighbourhoods may be adversely affected, or even where large vehicles can become obstructed. Diversion onto unsuitable routes is a problem that could be mitigated through collaboration between digital navigation providers and road authorities.

Beyond the rerouting of traffic to less congested roads, there is a feature of digital navigation that mitigates the unwelcome experience of traffic congestion – the prediction of journey time, or estimated time of arrival (ETA). When road users are asked about their experience of congestion, both in surveys and in discussion, the evidence from their responses indicates that the uncertainty of journey time is a more important adverse consequence than lower speed. Accordingly, an important benefit of digital navigation is the forecast of ETA in the light of prevailing traffic conditions on the selected route, in this way substantially reducing journey time uncertainty.

While diversion onto less congested routes may be helpful for users of digital navigation, there is a question as to whether this is optimal for users of the road network as a whole. Digital navigation employs proprietary algorithms whose performance is difficult to assess externally. An algorithm might response to build up of congestion by diverting all traffic to a single alternative route until that became congested, repeating the process to spread traffic across available routes until congestion abated. Or the algorithm might spread traffic across all available routes at the outset. And the algorithm might anticipate the build-up of congestion based on historic experience. But in any event, the routing algorithm used by one provider would not take account of the activities of another provider. The providers of digital navigation services are very secretive and there is almost no published information on their design and performance.

The road system is generally well regulated to achieve safety and efficiency. Given the potential scale of impact of digital navigation devices on network operations, arguably a licensing regime would be appropriate for providers. This might require information to be exchanged with road authorities, guidance to be accepted to avoid adverse environmental and social impacts, and mutual collaboration to optimise the operational efficiency of the network as a whole, while at the same time optimising the experience of individual road users.