Behaviour change is a topic of continuing interest to transport professionals, with current focus on getting people out of their cars, to use instead public transport, walking or cycling. The main policy motivations are to reduce the harmful consequences of car use, in particular tailpipe carbon emissions and air pollutants, as well as to reduce road traffic congestion, enhance the sense of urban place, increase healthy exercise and improve the economic viability of public transport. This was the topic of contributions to a recent Transport Thinking Forum Round Table discussion on achieving behavioural change, organised in association with the TAPAS network. Here I offer some further reflections on the interesting contributions and on the practical possibilities.
A common approach to effecting behaviour change is conceptualised by the simple idea of ‘sticks and carrots’ – punishments for undesirable behaviour and rewards for better behaviour, judged against policy objectives. However, this was criticised as an unhelpful metaphor by Pete Dyson, a behavioural scientist who has worked at the Department for Transport, now at the University of Bath. He regards the concept as too simplistic and also problematic because the ‘stick’ element prompts pushback from those who see themselves as adversely affected, as well as from the politicians who aim to represent them, car users in particular (see also the book he co-authored with Rory Sutherland: Transport for Humans – Are we nearly there yet?).
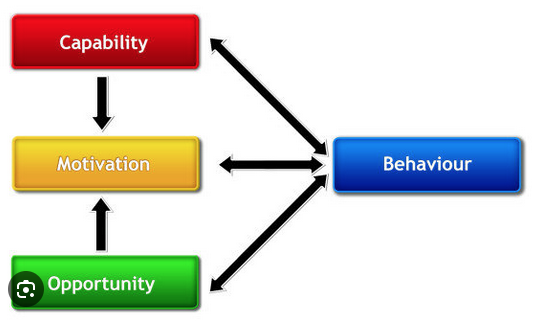
As alternatives to sticks and carrots, there are other concepts available including: Avoid-Shift-Improve, a general approach to environmental sustainability; the Upstream-Downstream model of behavioural change developed by the Behavioural Insights Team; and the COM-B model developed at UCL, which posits that behavioural change can only come about if there are in place all three elements of Capability, Opportunity and Motivation. The COM-B approach has been widely used in the public health context, for instance to encourage smoking cessation, and is one of a number of techniques that have been applied with success to improving road safety. The Scottish Government has stated that it has considered interventions to reduce car use in the context of the COM‐B model, although no detail has been provided.
Reducing smoking and improving road safety are generally seen as desirable objectives, so behavioural change interventions go with the grain of public opinion. But the objectives of reducing car ownership and use are very different, given that three-quarters of households in Britain own cars, which are seen both as useful for their utility in getting from A to B, as well as engendering good feelings associated with ownership (see my paper about Car Dependence). The M of COM-B is therefore largely lacking, so attempting to reduce car use by measures based on behavioural insights alone would be pushing uphill. On the other hand, interventions to foster electric vehicle purchase could be effective since the Capability to drive is as for internal combustion engine vehicles, there is Opportunity to purchase EVs, albeit only a limited used car market at present, and Motivation takes the form of lower operating costs and environmental virtue.
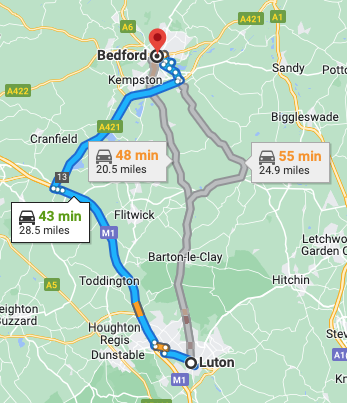
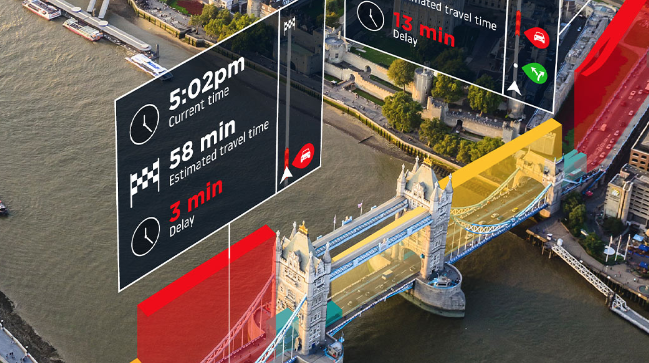
Measure to promote EV uptake, such as investment in public charging points, can be seen as examples of the well-known approach known as ‘nudging’, a concept from behavioural economics that proposes adaptive designs of the decision environment as ways to influence the behaviour and decision-making of groups or individuals. Nudging is not a stick, in that compliance with the intention of the nudge is optional, nor is it straightforwardly a carrot in that the benefits of compliance may not always be self-evident. Richard Thaler, Nobel laureate in economics and a populariser of the concept, has cited satnav technology as an example: you decide where you want to go, the app offers possible routes, and you are free to decline the advice if you decide to take a detour. While this is a neat example, its ambition is quite limited. Nudging people to make significantly less use of cars by means of such ‘soft’ measures would seem likely to have only small impact, in the absence of complementary ‘hard’ unavoidable interventions.
One challenge to the usual view of behaviour change in the transport sector was put by Tom Cohen of the University of Westminster, at the TAPAS meeting, who argued that the overwhelming majority of interventions can be expected to lead to changes in behaviour, so that ‘behaviour change’ is simply the right way of doing transport planning, and not a subset of interventions such as those based on marketing or by appealing to our better nature. In short: transport is movement; movement is behaviour; so transport planning is travel behaviour planning. The implication is that we should look to packages of complementary interventions, of the kind envisaged by transport planners, to achieve behaviour change.
Also at the TAPAS meeting, Lisa Martin, of consultancy Steer, reviewed UK experience of packages of interventions aimed at changing travel behaviour, including those supported by the Sustainable Travel Towns demonstration projects and the Local Sustainable Travel Fund. Evaluation indicated that while high value for money could be obtained, as judged by the benefit-cost ratio, yet the impact on car use and/or traffic levels was quite small, of the order of 2%. This has not been sufficient to ensure that such packages are in the mainstream of approaches to transport decarbonisation, where typical aspirations of local and regional authorities are to achieve 20% reductions in car use by as early as 2030. Moreover, the ‘cost’ represented in the benefit-cost ratio is the economic cost. What is disregarded is the political cost that may be experienced by politicians, local and national, in advocating measures that engender pushback from those who feel they would be adversely affected, drivers and others.
There is certainly merit taking a broad view to identify packages of measures that might persuade, enforce or nudge travel behaviour change in directions helpful to wider policy purposes. Yet in practice much of the debate in the transport sector is about the consequences of investment in new road and rail capacity, the behavioural consequences of which tend to be multifaceted, yet which is supported by analysis and modelling that narrowly focuses on estimates of economic benefits that make simplifying assumptions about changes in travel behaviour. There are opportunities for behavioural scientists to question these simplifying assumptions, in particular that the main benefit of investment that results in faster travel is the saving of travel time that is used for more work or leisure activities. On the contrary, there is much evidence that, over timescales relevant for investment appraisal, the main benefits take the form of enhanced access – to people and places, family and friends, employment, services and activities, with ensuing increases in opportunities and choices. The travel-time-saving simplification is computationally convenient but does not capture the real behaviour of users. This means that conventional transport models whose outputs are traffic speeds and volumes, comparing with- and with-out investment cases, are behaviourally misleading. Models that project changes in access would be a better basis for investment decisions, as behavioural analysis would reveal.
Nevertheless, given that the conventional methodology for investment appraisal is so well established, a consequence is a search for approaches to effecting behavioural changes that can be pursued outside this orthodoxy, hence the continued popularity of ‘sticks and carrots’ as well as interest in alternative approaches that avoid direct confrontation with the economists.
The general problem we face is that the system of travel/transport is particularly complex, has evolved over time in parallel with our built environment, and where remedies to problems tend to be specific to particular locations. This makes it difficult to gain a sufficiently deep understanding of what is going on and what options are likely to succeed in ameliorating detrimental aspects and/or enhancing positive features. Einstein said: ‘Everything should be made as simple as possible, but not simpler’. While perhaps more straightforwardly relevant for physical systems, this maxim begs the question of how simple descriptions of complex systems can be before the charge of oversimplification could be legitimately laid. My own view is that there is scope for simplification through the application of heuristics – rules of thumb, mental shortcuts – that are good enough accounts of what’s going on and what our options are, and that will promote common understanding – a topic on which I will write at greater length on a future occasion.
In the end, the test is ‘what works’ – the observed outcome in the real world of behavioural interventions. Reasonably clear outcomes may be observable in the case of sticks, such as adjustments to taxation, implementation of changes in road layouts or of charging schemes aimed at reducing vehicle emissions or traffic congestion. Similarly, the impact of carrots in the form of cash incentives can often be measured. But more nuanced interventions such as nudges may be harder to document.
Outcomes of behavioural interventions may be observed from experience in other countries. Yet local conditions and behavioural responses may be significantly different from those in the UK. For instance, Paris was one of the first cities to allow rental electric scooters, but then was one of the first to ban them on grounds of safety, following a referendum. But that is not to say that other cities would follow the example of Paris. Nevertheless, the idea of trialling an intervention for a defined period and then having a vote may be a practical way of testing public acceptability. Stockholm’s congestion charge was trialled for a seven-month period, then turned off prior to a referendum, the outcome of which led to permanent implementation.
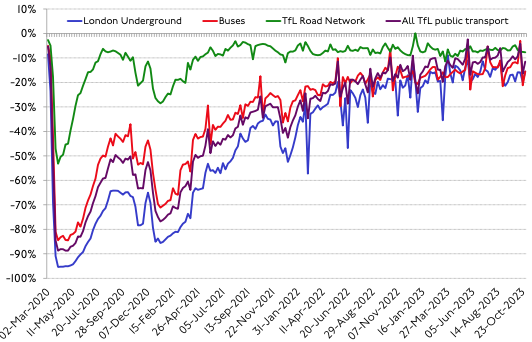
The substantial scope for travel behaviour change was illustrated by the coronavirus pandemic, which had a major impact on travel behaviour largely through unavoidable constraints imposed by governments, an example of a big stick, deployable in extraordinary times. But once these constrains were removed, people reverted largely to their previous travel behaviour, which reflected prior choices about where they lived in relation to where they worked, to where family and friends lived, where their children were educated, as well as activities and services they had become accustomed to access. Such reversion implies that large changes in travel behaviour could not realistically be delivered in a democratic society in normal times.
While there is undoubted scope for the application of behavioural science to investigate how travel behaviour might usefully be changed incrementally, in practice on/off trials plus referenda might provide both a practical test of acceptability as well as a justification for initiatives by sufficiently bold politicians. And after a decision to implement permanently, evaluation on short-, medium- and longer-term timescales would help inform subsequent decisions.
Yet when contemplating the possibilities for travel behaviour change, we should not fail to recognise that the car has provided valued access benefits to a majority of households, notwithstanding its problems. Persuading people to use their cars less would therefore require provision of alternative modes that feel to them at least as good, reinforced by effective, probably incremental constraints on car use. Whether we use the shorthand of ‘carrots and sticks’ to describe such complementary measures is less important than finding the funding to invest in attractive alternatives to the car, particularly rail-based travel in urban areas where the economic viability of public transport is most feasible. In the absence of good alternatives, getting people out of their cars would be difficult, regardless of the sophistication of our behavioural analysis.