
Introduction
A significant new element is being enthusiastically introduced by the Department for Transport (DfT) to the ‘toolkit’ for transport planning in the shape of its new Connectivity Metric. I offer my views on its relevance and suitability, some thoughts on its most appropriate uses, and discuss the wider implications of the proposed new approach to decision support with the aid of the tool.
What is connectivity?
The purpose of the transport system is to enable people and organisations to reach the destinations from which they would benefit by gaining access. To understand what improvements and additions it would be worthwhile making to the current transport network, it could be helpful to have a measure of connectivity between trip origins and destinations, and how such connections might be enhanced. To this end, in December, the DfT, in partnership with the Ministry of Housing, Communities and Local Government (MHCLG), published details of a new Transport Connectivity Metric developed by the DfT, which measures an individual’s ability to reach employment, other public and commercial facilities, services and social engagements. This metric evaluates the value of destinations and the opportunity to reach such destinations using various modes of transport, including walking, cycling, driving and public transport, and considers different purposes of travel, such as employment, education, shopping, leisure and healthcare.
In launching the new Connectivity Tool, which implements the Metric, Heidi Alexander, Secretary of State for Transport, stated that this would move toward a vision-led approach to planning, targeting investment in transport infrastructure that enhances connectivity to under-served communities, and support the unlocking of development sites. Matthew Pennycook, Housing Minister at MHCLG, linked the Tool to proposed reforms of the National Planning Policy Framework, to provide the ‘objective evidence base’ required to meet new mandatory housing targets, without creating car-dependent ‘commuter deserts.’
This all suggests that the government sees the new Tool as helping to boost home building and other development in the most effective way, as part of its core policy to stimulate economic growth. The question is whether it is likely to fulfill expectations.
Earlier studies
The new Connectivity Metric, the fruit of a decade of development, is the successor to the DfT’s Journey Time Statistics, published between 2015 and 2019, which in turn succeeded the Core Accessibility Indicators, first published in 2008. The Journey Time Statistics covered the shortest travel time to a given type of service by a particular mode of transport, averaged over an area; the proportion of users in a given area that could access a service within a given time; and the number of different services in a particular area that users could reach within a given time. However, the DfT now claims that the methodology and technologies used in the production of these statistics involved very lengthy processing times and a large amount of dedicated resource. Over time, this has meant the statistics developed an increasingly large lag between the period they related to and their publication.
Accordingly, the DfT has seen the merit of developing the new Connectivity Metric, designed to be used for both monitoring and appraisal purposes, to understand the impact of policy interventions. It aims to calculate a connectivity score for all of the geographic areas covered by the previous journey time statistical series, based on the purpose and mode of travel. The intention is to demonstrate improving connectivity across the UK and growing the economy by enhancing the transport network, a DfT ‘Priority Outcome’ as part of the Spending Review settlement in 2021, and still recognised as such.
As part of of my long-standing research interest in the factors affecting travel demand and the provision of transport services, I had taken advantage of the earlier Core Accessibility Indicators to investigate the relationship between mobility and access to, and choice of, key destinations: primary and secondary schools, further education colleges, family doctors, hospitals, food stores, and places of employment. For the populations of 353 English local authorities, I estimated the average extent of choice of these destinations as a function of travel time and mode. For instance, for a GP surgery reached within a 15-minute journey by public transport and/or walking, there is a wide distribution of access across the local authorities, highest in urban areas, least in rural. But for a 30-minute journey by these same modes, the population of a majority of local authorities have the choice of five or more GPs. Of course, the car provides more choice: the populations of nearly all local authorities have access to five GPs within 15 minutes by car, exemplifying the enhanced level of access available by this mode (which accounts for nearly two-thirds of all trips).
These findings were consistent with my previous suggestion that the demand for daily travel has largely saturated, as I proposed in a 2010 paper entitled ‘Saturation of demand for daily travel’. As evidence, I cited a study by the then Competition Commission of access to supermarkets, which estimated that 80 per cent of the urban population could reach three or more large stores within a 15-minute drive, and 60 per cent get to four or more.
You could ask yourself, in these circumstances, if you could choose between three or four large supermarkets within 15 minutes driving, would you wish to travel further to reach a fourth or a fifth. If not, we would say that your demand for travel for the purpose of accessing a supermarket has ‘saturated’, a standard concept in consumption economics.
If you don’t use a car to shop, you could ask the same question about access to local foods stores within, say, a 10-minute walk, the choice available being dependent on the density and prosperity of the neighbourhood. Certainly, there are locations where choice is limited, in rural areas and low-income urban ‘food deserts’. Nevertheless, my conclusion is that high levels of access and a good choice of commonly used destinations are on offer to the large part of the population that has available a car or good public transport, such that there is little need to travel further to satisfy these needs.
Regrettably, the concept of ‘travel demand saturation’ has not generated interest from transport economists and planners, whether to endorse or to rebut. Hence it seems worth considering whether the DfT’s new Connectivity Metric would shed further light on this dimension.
The mechanics of the new Metric
How the new Metric works is quite complex and opaque, and I do not pretend to understand the account of the software and modelling (where reference is made to a number of algorithms and programme languages: Dijkstra, Rust, KD-tree, Tobler’s hiking function, Valhalla’s routing data engine, scipy Python). But let me summarise the main points of the methodology, as I understand it, that I think will be relevant for those interested in the outputs:
- Trip origin and destination data derive from Ordnance Survey, post code directories and other official sources, as are transport networks. Willingness to travel is inferred from National Travel Survey findings. Each node in a transport network that is within reach of an origin provides connectivity value to that origin for each combination of destination type, mode of transport and time of travel. For example, a large employer at a node that is easily accessible by a train station means that node will have a high value for the purpose of employment and the public transport mode.
- The connectivity model calculates which destinations are accessible within 60 minutes from each origin point and determines the value they add to that origin. The main output is a one-hour connectivity metric, encompassing the value of destinations that can be reached in this time, as a function of mode and purpose of travel. This lumps together different kinds of destinations for the same broad purpose, for instance GP surgeries, hospitals, opticians, dentists and pharmacies to provide a healthcare connectivity metric. But on the other hand, the locations are very granular, covering 15 million 100 metre-square areas in England and Wales. The outputs are adjusted such that the origin location with the best score receives a scaled score of 100 and all other locations receive a score which is relative to that, such that an origin location with a score of 50 is considered to be half as ‘connected’ as the best location.
- One factor influencing a network node’s contribution to the connectivity score of an origin point is the diminishing returns effect. This parameter represents the decreasing incremental utility of accessing multiple destinations of the same type (as for example to supermarkets, discussed above). Such parameters were estimated through internal research and validated through consultation with local authorities.
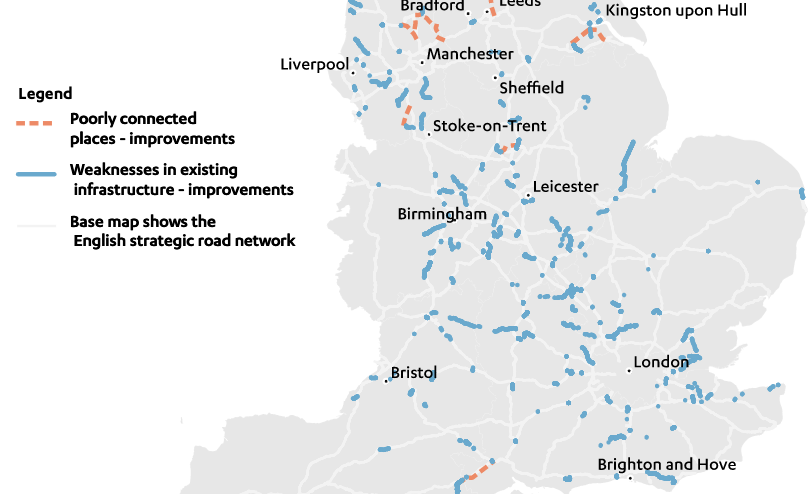
Outputs of the connectivity model are illustrated by ‘heat maps’ showing overall connectivity to all destinations, both by travel mode and by journey purpose. As the DfT’s supporting paper to the tool admits, these offer few surprises: higher scores are strongly associated with areas with more destinations that people consider of value. Overall connectivity is higher in urban areas because connectivity is about being able to get to valuable places quickly, and as such the connectivity scores will inherently increase with the density of development and number of destinations.
By region of England and Wales, overall connectivity is highest in London, with a median score of more than 80, and lowest in Wales with a median below 60, but with wide spreads about the median in all regions. For particular locations, more frequent public transport, less congested roads and more direct cycle routes would all increase the connectivity score. Yet areas closest to city centres aren’t always the highest scoring, due to local differences between specific locations distributed around the centre, including road networks, public transport options and cycling routes.
The DfT paper recognises that driving by private car is – not surprisingly – ‘the great equaliser’, being the mode that will result in highest connectivity in rural areas as compared to the best area (which is London), while for other travel modes, high connectivity is much more clearly clustered in ‘hot zones’ of urban areas.
How useful will be the new Connectivity Metric?
The Department states that the new Connectivity Metric has been designed to be used for both monitoring and appraisal purposes, to understand the impact of policy interventions. Yet having gone to considerable effort to create this metric, the DfT fails to clarify or illustrate how it might be used by transport policy makers or practitioners.
Presumably, a local authority might estimate the connectivity of a greenfield site for a proposed housing development, finding a high value for car access, but lower for other modes unless provision for active travel and public transport could be materially enhanced. But this situation is surely already well understood. Also well understood is that a well-connected city centre site is a location where new homes could be provided with no car parking spaces. So, we need to ask how would quantification help?
One situation where a quantified measure of connectivity would seemingly be useful is where a wholly new development is planned, such as a New Town. The government has endorsed the report of a Task Force that identified twelve promising locations. The spatial location of homes, services and transport provision could be considered as a whole, employing the connectivity metric to maximise access for the residents, a point made by Conrad Bailey, the DfT’s DG for public transport at the Local Transport Summit held in Derby on 18 November. Yet such wholly new developments will be few in number.
More generally, quantification of connectivity could be useful if it could be linked to associated economic value, such that measures to improve connectivity could be subject to cost-benefit analysis. For example, recent market research from the Nationwide Building Society looked at the value buyers and renters place on being close to rail, underground and tram services in London, Manchester and Glasgow, finding a £42,700 premium in London for property 500m from nearest station, compared with a similar property 1,500m away. The equivalent figures are £10,900 for Manchester and £8,800 for Glasgow. On average, survey respondents were willing to pay 8 per cent more to live in an area with good transport links compared to an area with poor links.
These findings reflect choices of residence in relation to existing rail services, higher property values being associated with better connectivity. There have also been a number of academic studies that found a similar relationship between new rail investments and the consequential enhancement of property values.
One important feature of the Connectivity Metric is that it recognises that improvements in connectivity offer diminishing returns (diminishing marginal utility, as economists would say), consistent with the property value evidence and with the concept of travel demand saturation.
Access, made possible by connectivity, increases with the square of the speed of travel, being proportionate to the area of a circle whose radius is proportionate to the speed if travel (qualified by the density of the road network). Access, increasing with the square of the speed and being subject to diminishing returns, is therefore subject to saturation, as I explained in my recent book, Travel Behaviour Reconsidered in an Era of Decarbonisation (section 2.5).
In contrast, the orthodox approach to transport investment cost-benefit analysis, as set out in the DfT’s Transport Analysis Guidance, supposes time saving to be the main benefit of faster travel, with no suggestion of diminishing returns, and so no limit to the scale of investment in additional capacity. But diminishing returns does indeed imply a natural limit to investment to enhance connectivity and access, and has led me to propose that we have a largely ‘mature’ transport system, with limited benefits from further infrastructure investment (section 7.2 of my book).
We already recognise that urban road networks are now mature. The capacity of many of these were enlarged in the last century to accommodate the growth of car ownership and use, including new elevated motor roads and ‘flyover’ junctions, widened arterial roads and major one-way traffic flows (‘gyratories’). But the damage to the urban environment was soon recognised and such carriageway enlargement ceased, and in many situations has been reversed to create an improved urban environment and a better ‘sense of place’.
Accordingly, when faced with delays from urban traffic congestion, we do not propose to enhance connectivity by adding to road capacity, but now aim to manage demand, for instance with London’s congestion charging scheme, Nottingham’s Workplace Parking Levy, and generally by the management of kerbside access and the promotion of public transport and active travel.
I have proposed in my book that the concept of transport system maturity is now appropriate for interurban roads as well as for urban roads, and also for interurban railways and airports. The implication is that we should aim to make best use of the infrastructure we already have, largely avoiding costly investment in new major civil engineering structures. Accordingly, I was pleased to see recognition in the UK Infrastructure: 10 Year Strategy, published by HM Treasury and the new National Infrastructure & Service Transformation Authority in June, that ‘The UK has a mature transport network, but one with a large and growing backlog of maintenance and renewal needs.’ (para 3.9).
As it stands, the new Connectivity Metric might be used to monitor ex post the consequences of a transport investment, and even to project ex ante gains in connectivity from an investment. But without being able to attach an economic value to such changes, there could be limited input to decision making, which has to be focused on allocation of a finite budget for investment.
Moreover, the lumping of different types of destination for the same broad journey purpose is unhelpful. For instance, a location with a low connectivity score for access to healthcare might reflect any of the absence of a suitably located GP practice, a run-down high street that is unattractive to retailers such as pharmacies and opticians, the relocation of a hospital to a newly built site further away, or a national shortage of dental practices.
In such situations, improvements to bus services might be one means of enhancing connectivity, while government funds for NHS improvements, and to help local authorities to support urban enhancements, may improve effective connectivity by means other than transport investment. Thus, the new connectivity metric may lack sufficient granularity of purpose to be useful for decision making.
The concept of ‘connectivity’ seems to place emphasis on measures to improve transport services. However, the related ideas of ‘access’ and ‘accessibility’, extensively discussed in the research literature, have broader applicability, including to organisations aiming to meet the needs of individuals other than as transport providers. For instance, Professor Glenn Lyons has advocated the concept of ‘Triple Access Planning’, which takes account of how changes to land use and telecommunications, as well as to transport, can enhance access. So metrics for access may have a greater impact than a metric for connectivity.
The Connectivity Metric aims to measure an individual’s ability to reach employment, services and social engagements. A similar approach might be used to assess business connectivity – how firms are connected to suppliers and customers, for both individual business travel, and the transport of freight. This would be relevant to use of both road and interurban rail networks, which are shared with non-business users and for which connectivity is mutually dependent.
Improving connectivity for businesses is expected to increase agglomeration benefits, which are difficult to estimate with current methodology. A connectivity metric for businesses might constitute an additional dimension to the tool’s usefulness, especially if economic value could be associated with changes in connectivity.
What next?
The new Connectivity Metric doesn’t show how many people take different routes or forecast how many may do so – purely the opportunity it gives them. Nor is it a transport model: there is no trip assignment or convergence processes. Hence the metric is based on a static model and hypothetical trips, which raises the question of why a transport model was not employed at its core to estimate connectivity from observed trips.
The providers of digital navigation services (commonly known as satnav), such as Google Maps and TomTom, employ models of the road network that function in real time, using traffic information to project journey times from chosen origins to chosen destinations. Such ‘digital twins’ therefore allow estimates of connectivity, an approach that is being extended beyond routing advice.
Thus, TomTom’s Origin-Destination Analysis offers insights into where trips begin and end, which can be used to identify locations for developments that are well connected. Transport consultant SYSTRA has adopted TomTom’s services, intending to build transport models that replicate real-world traffic conditions, to permit analyses of the potential impacts of infrastructure investments, schemes, and policies that could improve connectivity.
I fail to understand why the DfT, National Highways and road authorities generally seem so averse to considering the application of existing digital navigation tools to both network management and planning, in the present case to identify and implement measures to improve connectivity.
The DfT makes clear that as the new metric yields its first estimates of connectivity, it welcomes feedback to inform future developments and refinements. The connectivity estimates are therefore to be regarded as experimental statistics and should not be used by themselves for policy or decision-making. They are published on a provisional basis as research into a new method that enhances and supplements the previously produced journey time statistics. Accordingly, the DfT advises caution when using the data.
Clearly, feedback from users would be important in ascertaining whether the new metric is fit for purpose. I recall a study commissioned by the DfT of its long-established National Trip End Model (NTEM) to understand the needs of users of the model. This study found widespread recognition of the complexity, even impossibility, of what NTEM sets out to achieve, and consistent patterns of user frustration; in particular it was considered extremely challenging to understand exactly what NTEM is for, what to do in certain circumstances, or from where an output has come. Evidently such an outcome is hopefully to be avoided with the new Connectivity Tool.
While awaiting the experience of the first users, it would be desirable to commission a peer review of the methodology, to address quality and capability. A peer review of the latest version of the DfT’s National Transport Model identified a number of shortcomings, including the identification of some significant counterintuitive results. These may reflect major issues with the model design or implementation.
Altogether, my sense is that the DfT analysts, faced with a challenging problem, have come up with an elaborate, but opaque, methodology whose utility in practice is difficult to assess at present. Arguably, the previous approach of estimating journey times from where people live to key local services was straightforwardly intuitive, as is the approach adopted in a new report on integrating transport from the Centre for Cities. This utilises public transport connectivity in and around conurbations, measured as the number of people who can reach a principal city centre within a specified ‘reasonable journey’. In contrast the DfT’s new connectivity metric is defined vaguely as ‘someone’s ability to get to where they want to go’. Would improvements in such a generic metric seem worthwhile to the electorate, I wonder?
The DfT’s Transport Analysis Guidance methodology is excessively elaborate, all 1700 pages, that requires an enormous amount of effort to comply on the part of public sector transport undertakings, local authorities, their consultants, and the departmental officials who vet the investment cases – effort which is not justified by the outcomes of the appraisal process. I fear that the new Connectivity Metric may be a further example of an elaborate effort to achieve methodological rigour trumping useful application to policy decisions.
In summary, the DfT’s new approach to quantifying connectivity is certainly an impressive methodological exercise. Yet it is substantially static, reflecting the relatively unchanging nature of the built environment we have inherited, within which nearly all trip origins and destinations occur. And while granularity of place is very high, the lumping of journey purposes into very broad-brush categories may prove unhelpful for decision makers. Hence it remains to be seen how applicable the new metric will be to dynamic situations involving location decisions and trade-offs by place and purpose made by developers, businesses and individuals.
Nevertheless, a potentially important implication of the new metric is recognition by the DfT of diminishing returns to investment to increase connectivity. This then requires consideration of the concepts of travel demand saturation and network maturity, and of the consequences for projections of future travel demand and of infrastructure investment.
This blog post is the basis for an article published in Local Transport Today of 22 January 2026.