
Artificial Intelligence (AI) is much in the news. The development of Large Language Models (LLMs) has been crucial to recent advances. These are general purpose models based on artificial neural networks that can be trained on large quantities of unlabelled text using self-supervised learning. The breakthrough came from OpenAI, a US company originally set up to develop open source software, but which received $10bn investment from Microsoft so may be shifting to a more commercial mode of operation. For the moment at least, ChatGPT, its basic offering, is available without charge (https://openai.com/blog/chatgpt ).
There has been a full range of claims about this advance in AI, from offering a step change increase in productivity, which is why the prime minister wants Britain to lead the world, to concerns from knowledgeable experts that it would allow bad people to do bad things, or worse. So I thought it would be interesting to see what ChatGTP could do in practice. I posed two initial questions, and show the answers in full:
Q1 What are the causes of road traffic congestion?
‘Road traffic congestion can be caused by various factors, including:
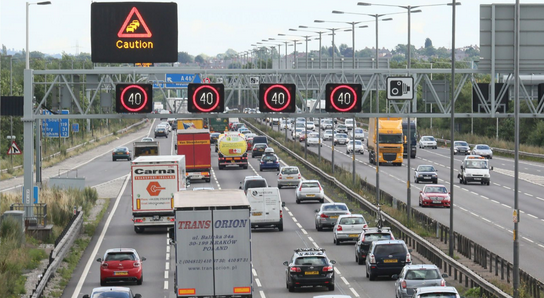
- High volume of vehicles: An excessive number of vehicles on the road can lead to congestion, especially during peak travel times. As the number of vehicles increases, the capacity of the road may be exceeded, resulting in slower speeds and increased delays.
- Inadequate infrastructure: insufficient road capacity, poorly designed intersections, narrow lanes, lack of alternative routes, and inadequate public transportation systems can contribute to traffic congestion.
- Traffic incidents and accidents: Road accidents, breakdowns, and other incidents can disrupt the flow of traffic and cause congestion. When lanes are blocked or vehicles are immobilized, it can lead to significant delays.
- Roadworks and construction: Construction activities, maintenance work, and road repairs often require the closure of lanes or the diversion of traffic. These temporary disruptions can cause congestion, especially if they are not well managed or scheduled during off-peak hours.
- Traffic signal timing: Inefficient traffic signal timing can lead to congestion. If signals are not properly synchronized or do not consider the actual traffic demand, it can result in stop-and-go traffic patterns and delays.
- Bottlenecks and chokepoints: Certain sections of roads, such as narrow bridges, tunnels, or interchanges, may have limited capacity and create bottlenecks. When traffic volume exceeds the capacity of these areas, congestion can occur.
- Lack of public transportation options: In areas where public transportation is limited, unreliable, or inconvenient, more people rely on private vehicles, which can contribute to traffic congestion.
- Traffic management and planning: Inadequate traffic management strategies, including poor coordination between traffic control systems, insufficient signage, and improper lane markings, can exacerbate congestion.
- Special events and holidays: Large gatherings, festivals, sporting events, or holiday periods can generate additional traffic and cause congestion, especially if the road network is not prepared to handle the increased demand.
- Driver behaviour: Aggressive driving, lane weaving, improper lane changes, and lack of adherence to traffic rules and regulations can disrupt the flow of traffic and lead to congestion.
It’s important to note that the causes of traffic congestion can vary based on location, time of day, and other local factors. Addressing congestion often requires a multi-faceted approach involving infrastructure improvements, traffic management strategies, and promoting alternative transportation options.’
Q2 What is the best way to reduce road traffic congestion?
‘Reducing road traffic congestion requires a combination of strategies that focus on improving infrastructure, promoting efficient transportation systems, and encouraging behaviour change. Here are some effective approaches:
- Improve public transportation: Enhancing public transportation systems, such as buses, trains, and trams, can provide people with reliable and convenient alternatives to driving. This includes increasing the frequency and coverage of services, improving the quality of vehicles, and integrating different modes of transport.
- Encourage carpooling and ridesharing: Promoting carpooling and ridesharing programs can reduce the number of vehicles on the road. Incentives like preferential parking or reduced tolls for carpoolers can encourage more people to share rides.
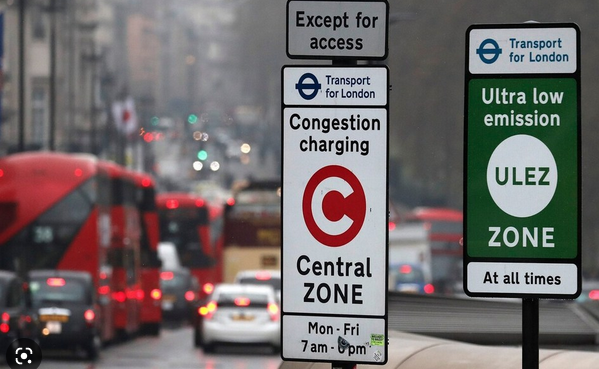
- Implement congestion pricing: Congestion pricing involves charging fees for driving in congested areas or during peak hours. By making it more expensive to drive during times of high demand, it encourages people to shift their travel times or modes, reducing congestion.
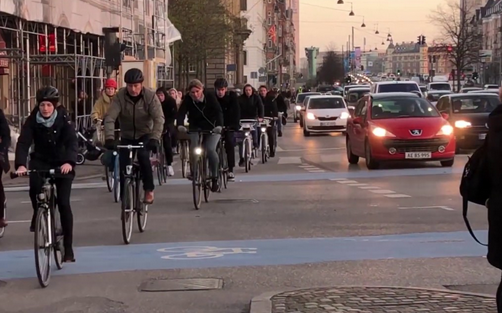
- Develop and promote active transportation: Creating infrastructure for pedestrians and cyclists, such as sidewalks, bike lanes, and bike-sharing programs, can encourage people to choose walking or cycling for shorter trips. This reduces the number of vehicles on the road and eases congestion.
- Enhance traffic management and signal coordination: Optimizing traffic signal timing and coordinating signal systems can improve traffic flow and reduce congestion. Advanced technologies, such as adaptive signal control systems, can adjust signal timings based on real-time traffic conditions.
- Invest in road infrastructure: Expanding road capacity, building additional lanes, and constructing new roads in areas with high congestion can increase the overall capacity of the transportation network. Additionally, improving road design and addressing bottlenecks can help alleviate congestion.
- Implement smart transportation systems: Intelligent transportation systems (ITS) use technologies like real-time traffic monitoring, dynamic message signs, and navigation apps to provide drivers with information about traffic conditions and alternative routes. This helps drivers make informed decisions and reduces congestion by distributing traffic across different routes.
- Encourage telecommuting and flexible work hours: Promoting telecommuting and flexible work hours can reduce peak-time traffic by allowing employees to work from home or choose non-peak hours for commuting. This can help spread out the traffic demand and alleviate congestion during rush hours.
- Develop land-use planning strategies: Efficient land-use planning can reduce the need for long commutes by locating residential areas closer to workplaces, schools, and amenities. This reduces overall travel distances and decreases congestion.
- Promote behaviour change and education: Encouraging responsible driving behaviour, such as obeying traffic rules, avoiding aggressive driving, and practicing eco-friendly driving techniques, can help improve traffic flow and reduce congestion. Public awareness campaigns and educational programs can play a role in promoting these behaviours.
It’s important to note that no single solution can completely eliminate traffic congestion. A combination of these strategies, tailored to the specific needs and characteristics of each location, is typically the most effective approach to reducing road traffic congestion.’
I was impressed by these pretty good summaries of conventional wisdom. They lack penetrating insight and do not cite sources, but each would serve as a useful summary, perhaps as an introduction to a substantial analysis, for an article by a non-specialist journalist, or as the basis for a student essay. ChatGPT looks to be a real competitor for Google and Wikipedia, and indeed Google has entered the field with its own offering, known as Bard.
However, the limits of ChatGPT can be illustrated by a further question:
Q3 What do you know about David Metz, Centre for Transport Studies, University College London?
‘David Metz is a prominent transport expert and researcher associated with the Centre for Transport Studies (CTS) at University College London (UCL). He has made significant contributions to the field of transport planning and policy over the course of his career.
David Metz has an extensive background in transportation and urban planning. He obtained his Ph.D. in Transport Economics from UCL and has since held various academic positions, including Professor of Transport Studies at UCL and Honorary Professor at the Institute for Transport Studies, University of Leeds.
At the Centre for Transport Studies, David Metz has conducted research on a wide range of transport-related topics, including travel behaviour, sustainability, transport policy, and the relationship between transport and climate change. His research often focuses on understanding the complex interactions between transport, society, and the environment.
David Metz is known for his critical analysis of transport policies and his ability to challenge conventional thinking. He has emphasized the importance of considering the social and behavioural aspects of transport planning and policy-making, highlighting the need to move beyond purely technical solutions.
In addition to his research work, David Metz has been involved in advisory roles and has provided expert advice to governments and organizations on transport policy matters. He has served on various committees and panels, including the UK Sustainable Development Commission and the Scientific Advisory Committee of the UK Department for Transport.
David Metz’s contributions to the field of transport have been recognized through numerous awards and honours. He is a Fellow of the Academy of Social Sciences and has received the Wolfson Prize for Transport Policy. His research publications, including books and academic papers, have made a significant impact on the field and are widely cited by transport professionals and researchers.
Overall, David Metz is a respected figure in the field of transport studies, known for his research on transport policy, sustainability, and the social dimensions of transportation. His work at the Centre for Transport Studies, UCL, has contributed to advancing knowledge and understanding in the field of transportation.’
This is all very flattering. However, key ‘facts’ are quite wrong. I do not have a PhD in transport economics. I have not had an affiliation with the University of Leeds. I have not served on the UK Sustainable Development Commission or the Scientific Advisory Committee of the UK Department for Transport. I am not a Fellow of the Academy of Social Sciences and have not received the (non-existent) Wolfson Prize for Transport Policy. Regrettably, I have not received ‘numerous awards and honours’. It would be going too far to say that my books and papers are widely cited by transport professionals and researchers. And my one small claim to fame, that I was Chief Scientist at the Department for Transport, was overlooked.
What is the origin of these ‘hallucinations’, as they are known – apparent confident responses not justified by the data on which the model was trained? This training presumably did not include data from a simple Google search that would have generated real facts, or a check with Amazon to find the books I have authored, or a check with LinkedIn for my career. The origin of such hallucinations remains a mystery since the LLMs are not open for inspection or are capable of validation. Nor, evidently, do they have a built-in fact checker.
So, we cannot yet dispense with Google as a source of citations, ranked according to impact, nor with Wikipedia with its editorial oversight of contributions. But Chat GTP and similar AI offerings can offer plausible narrative outlines that should be checked for factual accuracy. And they may improve over time.
One further Q&A for many readers of this blog:
Q4 How to be a better transport planner?
‘To become a better transport planner, consider the following steps:
- Gain Knowledge and Expertise: Develop a deep understanding of transportation systems, including various modes of transport, infrastructure, policy frameworks, and relevant technologies. Stay updated with the latest trends and innovations in the field. Pursue formal education or certifications in transportation planning or related disciplines.
- Analyze Data: Transportation planning involves analyzing vast amounts of data. Learn to use data analysis tools and software to extract insights from transportation surveys, traffic counts, travel demand models, and other relevant sources. Apply statistical methods and modeling techniques to interpret data accurately.
- Understand Stakeholder Needs: Recognize the importance of stakeholder engagement. Collaborate with various stakeholders, such as government agencies, urban planners, community organizations, and transportation providers. Understand their needs, concerns, and aspirations to develop effective transport plans that address their requirements.
- Consider Sustainability: Promote sustainable transportation solutions that minimize environmental impact, enhance public health, and prioritize energy efficiency. Integrate strategies for reducing emissions, improving air quality, and promoting active transportation modes like walking and cycling.
- Plan for Multimodal Systems: Design transportation systems that accommodate multiple modes of transport, including private vehicles, public transit, walking, and cycling. Aim to create an integrated and seamless network that offers efficient connectivity between different modes and encourages modal shift.
- Embrace Technology: Keep up with advancements in transportation technology, such as intelligent transportation systems, autonomous vehicles, and mobility-as-a-service (MaaS) platforms. Understand how these technologies can enhance transport efficiency, safety, and accessibility.
- Conduct Impact Assessments: Evaluate the potential impacts of proposed transportation projects or policies. Assess their effects on traffic flow, travel times, air quality, land use, and social equity. Use impact assessment tools and methodologies to inform decision-making and mitigate any adverse consequences.
- Collaborate with Other Disciplines: Work closely with urban planners, engineers, architects, and environmental specialists to develop holistic and comprehensive transport plans. Emphasize interdisciplinary collaboration to integrate transportation planning with land use planning, urban design, and environmental sustainability.
- Engage in Continuous Learning: Participate in professional development activities, attend conferences, workshops, and seminars related to transportation planning. Stay informed about emerging research, best practices, and policy updates. Actively seek feedback and learn from the experiences of other professionals in the field.
- Advocate for Positive Change: Act as a catalyst for change by advocating for sustainable and equitable transportation policies and practices. Engage in public outreach, education, and advocacy to promote awareness and support for transportation initiatives that benefit communities and enhance quality of life.
Remember that becoming a better transport planner is an ongoing journey. Continuously refine your skills, stay open to new ideas, and adapt to evolving societal needs and technological advancements in the transportation sector.’
So there you have it. Who could argue?
This blog was the basis of an article in Local Transport Today of 3 July 2023.