The House of Lords Environment Committee is carrying out an inquiry into public transport in towns and cities. I was asked to provide a submission, as follows.
The scope for public transport in cities and towns depends importantly on the level of car use, both because the car competes for passengers and because car traffic impedes the progress of buses, lessening their attractiveness.
The car is the dominant means of travel in Britain and other developed economies. It offers efficient door-to-door travel over short to moderate distances where traffic congestion does not lead to unacceptable delays and where parking is available at both ends of the journey. Public transport does not offer an attractive alternative to most car drivers in these circumstances. However, in urban areas where congestion causes delays and where parking is costly and limited, alternatives to car travel become attractive. To grow public transport use in towns and cities, it is necessary both to improve bus and rail services and constrain car use.
Urban travel and traffic
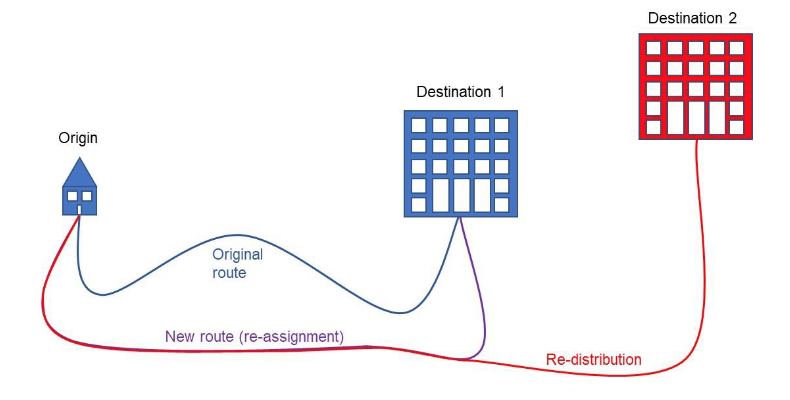
It is necessary to recognise that our availability of time always constrains the amount we can travel. There are many activities that we need to fit into the 24 hours of the day, and on average we spend just an hour on the move. This limits the build-up of road traffic congestion, which arises in areas of high population density and high car ownership where there is not enough road space for all the car trips that might be made. If traffic volumes grow for any reason, delays increase and some potential car users make other choices. We may change the timing or route of a car journey, or the travel mode where there are alternatives available, or a different destination such as an alternative shopping centre, or not to travel at all, for instance by shopping online.
Road traffic congestion is therefore self-limiting. We know from experience that we cannot build our way out of congestion by adding road capacity, since this allows previously suppressed car journeys to emerge, restoring congestion to the previous level. Conversely, if urban road space is taken away from cars in order to create bus or cycle lanes, then initially congestion will increase. But the additional delays will induce some car drivers to make alternative choices and congestion will revert to what it had been. The overall impact of reducing urban road space is to reduce the share of journeys by car.
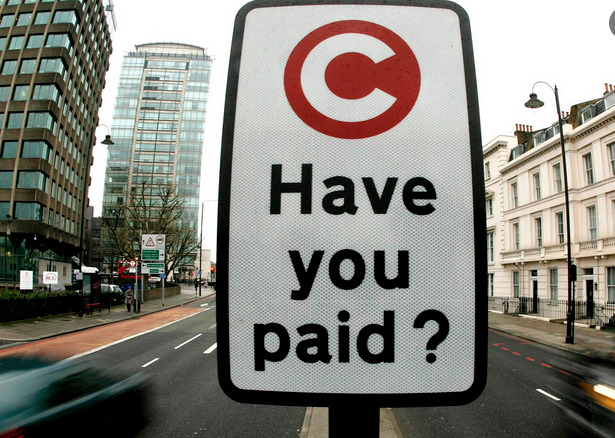
Accordingly, it is difficult to reduce the intensity of traffic congestion, but it is possible to reduce the amount of congested traffic by reducing road space available to general traffic, which can be publicly acceptable if alternatives to the car are provided. This is what has been happening in London over many years, as the population has grown, as there has been large investment in public transport, and as there has been a reduction in road space available for cars. Private transport use fell from 48% of all trips in 2000 to 37% in 2019, while public transport use grew from 27% to 36% over the same period. Cycling increased from 1.2% to 2.4% while walking held steady at 25%. The London Mayor’s transport strategy, published in 2018, ambitiously aimed to cut private transport use to 20% of all trips by 2041.
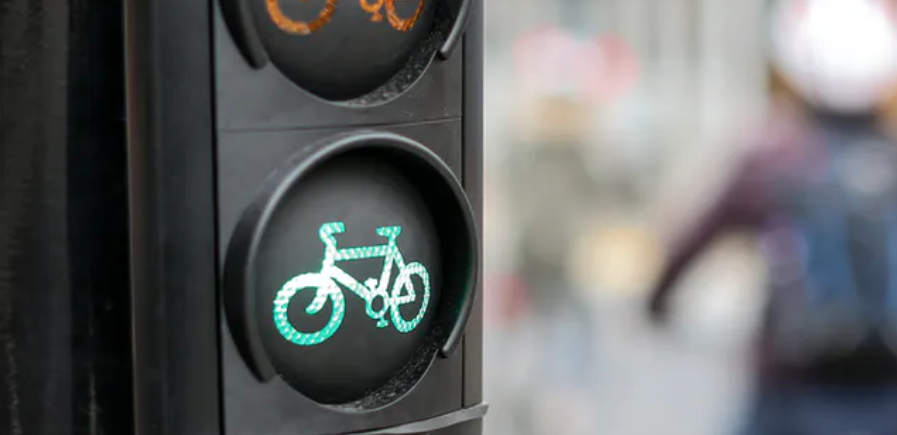
Creating cycles lanes reduces the space available for cars but in itself it does not get people out of their cars. Copenhagen is a city famous for cycling, with 28% of journeys made by bike. Yet car traffic is only slightly less than in London. Aside from cycling, the other big difference is that public transport accounts for only half the proportion of trips compared with London. The experience of Copenhagen indicates that we can get people off buses onto bikes, which are cheaper, healthier, better for the environment and no slower in congested traffic. Yet buses are an efficient way of using road space to move people in urban areas, with diesel engines being replaced by electric or hydrogen propulsion to cut carbon emissions. We would like to get drivers out of their cars onto bicycles, yet this has proved difficult, even in Copenhagen, a small flat city with excellent cycling infrastructure and a strong cycling culture.
Looking across a range of European cities, we find very diverse patterns of journeys by the different travel modes, reflecting, history, geography, size and population density. But we do not find cities with high levels of both cycling and public transport.
Policy options for towns and cities
British cities tend to have lower population densities than European counterparts on account of our preference for low-rise housing with gardens; this means that public transport is harder to deliver cost-effectively. British cities vary considerably as regards use made of public transport. Two otherwise seemingly similar cities, Brighton and Bournemouth, have very different shares of commuting by public transport – 23% and 7% respectively. Nevertheless, there are two broad policy options available to all towns and cities, for local decision:
- whether to push back the cars to increase street space for engagement by those on foot, with active travel and public transport as the alternative to the motorised mobility, as successfully implemented in London;
- or whether to accommodate car travel, as has been the practice in the past and as remains popular with many residents.
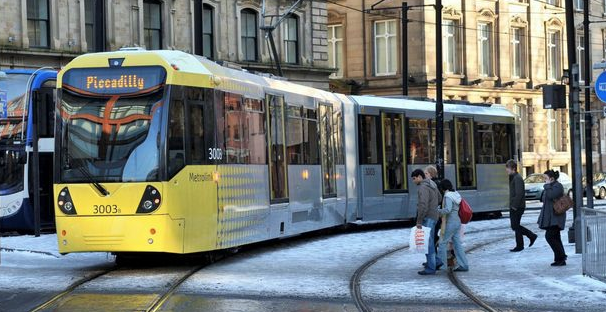
Pushing back the car requires improving the public transport alternative. Urban rail is fast and generally reliable, but costly to implement. It can provide an attractive offering, as for instance London’s Overground, created from existing underused tracks, and Nottingham’s tram network where an extension was financed from the proceeds of the local Workplace Parking Levy. Bus Rapid Transit on dedicated traffic-free routes is a less costly alternative to new rail, for example the Cambridgeshire Guided Busway. Buses on roads with general traffic, whether in bus lanes or not, offer a less attractive alternative to motorists – a chicken-and-egg situation.
Integration of public transport across the modes increases its attractiveness, as do the innovations adopted in London, including cashless ticketing with daily or weekly capped charges, and extensive real-time information about services available through mobile phone and other devices. The ability of city regions to take responsibility for public transport, on the London model, will be an important means to improve public transport where adopted.
The recent well-received Levelling Up White Paper identified twelve medium-term ‘missions’ to be pursued across all departments. The one specific to transport states: ‘By 2030, local public transport connectivity across the country will be significantly closer to the standards of London, with improved services, simpler fares and integrated ticketing.’ Although the rate of progress implicit in ‘significantly closer’ is vague, the direction of travel is clear and the objective is not in dispute. However, as well as devolving relevant responsibilities to city regions, it will be necessary to allocate additional funds on a sustainable basis. The experience of relying on private sector bus companies has shown that a high level of service cannot be sustained by commercial financing.
It would be worth considering the example of the French ‘versement transport’, a hypothecated urban regional payroll tax levied on the total gross salaries of all employees of companies of more than 11 employees, which was originally intended to raise capital for investment in local public transport infrastructure, but is more and more used to cover its operating expenses.
New technologies
There are four new technological developments affecting road transport:
- Electric propulsion, being adopted for buses, eliminates tailpipe emissions of pollutants and carbon, but does not otherwise change the nature of the service.
- Digital platforms are having a big impact on retail businesses. For transport, booking of rail and air travel has been transformed. Ride-hailing, exemplified by Uber, has made a major impact on the taxi business. There have been trials of Demand Responsive Travel whereby smartphone apps are used to book a trip on a minibus that operates a flexible route to meet demand, but the economic viability of this mode is not yet generally established.
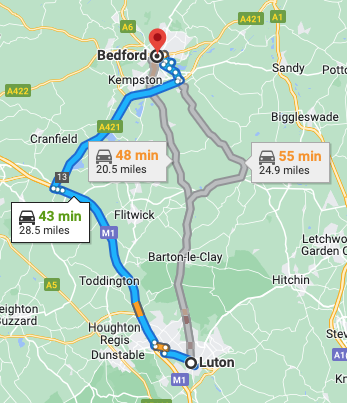
- Digital navigation, typified by Google Maps’ routing recommendations, is changing how the road network is used, but is not relevant to buses on fixed routes.
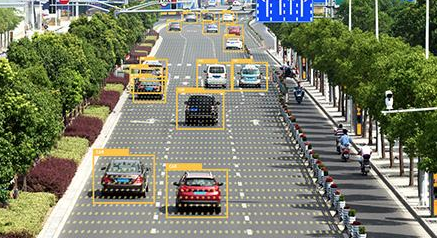
- Vehicle automation may offer the prospect of driverless buses, but whether this would be feasible in city traffic is far from clear, as is the cost of the technology and the support it might need. Driverless trains are possible on systems constructed for that purpose, such as the Docklands Light Railway, but an attendant rides on every train to oversee safety and security.
In short, it seems unlikely that public transport will be transformed by new technologies.
Summary
For public transport in towns and cities to be improved, the share of car travel needs to be reduced, to lessen both competition for passengers and road traffic congestion.
To reduce car use, better public transport is needed, which requires both local government to take overall charge of services and to have a sustainable source of funding beyond the farebox.
There are no new technologies that will make much difference.