I have a new paper on how time constraints affect our travel behaviour. The link to the journal is here. Some copies are free to download here. The manuscript is here. The abstract is below.

Considerable observational evidence indicates that travel time, averaged across a population, is stable at about an hour a day. This implies both an upper and a lower bound to time that can be expended on travel. The upper bound explains the self-limiting nature of road traffic congestion, as well as the difficulty experienced in attempting mitigation: the prospect of delays deters some road users, who are attracted back following interventions aimed at relieving congestion. The lower bound implies that time savings cannot be the main economic benefit of transport investment, which means that conventional transport economic appraisal is misleading. In reality, the main benefit for users is increased access to desired destinations, made possible by faster travel, which is the origin of induced traffic. Access is subject to saturation, consistent with evidence of travel demand saturation. However, access is difficult to monetise for inclusion in cost-benefit analysis. Consequential uplift in real estate values may be a more practical way of estimating access benefits, which is relevant to the possibility of capturing part of such uplift to help fund transport investment that enhances such access.

The Climate Change Committee has published a comprehensive and impressive analysis of how to achieve net zero carbon emissions by 2050. This includes a detailed treatment of surface transport, currently responsible for 22% of UK Greenhouse gas emissions, the absolute amount having changed little since 1990, stable in the range 110-120 MtCO2e annually. Cars account for 61% of surface transport emissions. Three options are proposed to secure emissions reduction:

Reducing demand for car travel by a variety of social and technological changes, including increased home working, online shopping, increased car occupancy though shared mobility, a shift to active travel and public transport, and more fuel-efficient driving.

Improving conventional vehicle fuel efficiency through regulation of road vehicle performance, use of biofuels, and more rail electrification.

Widespread deployment of electric vehicles (EVs) with the uptake of new battery EVs to reach 90-100% by 2030, in line with the government’s intention to phase out sales of new conventional cars and vans by that date. Driving range is expected to improve as battery technology advances. Sufficient charging infrastructure would be needed for the 30% of car users without access to off-street parking, as well as rapid charging for longer trips. The electricity supply system will need reinforcement.

The CCC has modelled the quantitative requirements associated with these options to show that it is possible to reduce surface transport emissions to 32 MtCO2e in 2035 and to 0.9 MtCO2e in 2050. The largest contribution comes from EVs. There are of course multiple uncertainties, many of which have been modelled.

The question is to what extent it will be possible to follow this emissions reduction pathway without measures beyond those already planned. Will it be necessary to create stronger incentives, for instance through more subsidy for EV charging facilities, or by making conventional vehicles more costly to operate through increased taxation? Changing relative prices can be a powerful incentive to change behaviour. It has not been helpful that public transport fares have risen much faster in recent years than the cost of motoring, in part due to a freeze on the rate of road fuel duty since 2010, reflecting perceived political sensitivities.

I am not optimistic about the practical possibilities that would increase the cost of car use, even for the virtuous cause of tackling climate change. We will have to make the most of regulation, the costs of which are more opaque, to effect the necessary changes.

The RAC Foundation has published a report on how information can be conveyed to drivers via connected vehicles. This assessed representative possibilities including In-Vehicles Signage (IVS) to display road signs and warnings to the driver inside the vehicle, and Green Light Optimal Speed Advisory (GLOSA) which tells drivers what speed to adopt to pass through the next set of traffic signals on green. The report discussed the obstacles to implementing these technologies, which it suggested arise mostly from organisational, institutional and human issues.

What was not adequately considered was the elephant in the room – the existing digital navigation (satnav) services, whether available free of charge as smartphone apps (Google Maps, Waze and others) or embedded as an integral part of the vehicle equipment. While the report mentions satnav devices as already providing some signage information, it envisages that a key element of the IVS concept is the ability for highway authorities to communicate directly with drivers, so that they can give them information they want them to receive (for example hazard warnings), as opposed to a satnav provider generating messages themselves.

Yet given the widespread use of digital navigation, it seems likely that the prime deciders of what information is conveyed to drivers will continue to be the satnav providers, not the highway authorities. The latter would need to make timely information available to the former if drivers are to benefit. But while highway authorities are subject to statutory regulation, providers of digital navigation are unregulated and are free to choose what information to provide to road users.

More generally, digital navigation has transformed how very many motorists use the road network, particularly for occasional, as opposed to regular, journeys. A choice of routes is offered at the outset of the trip, with estimated journey times, which mitigates the main perceived problem with traffic congestion – the uncertainty of time of arrival. Alternatives may be offered en route in response to the build-up of congestion. However, because the service providers of digital navigation are very secretive about their methodologies, we have little idea of the impact of their guidance on the overall functioning of the road network. For instance, we do not know if the rerouting in response to a crash on a motorway is optimal for users of the whole road network, or for drivers responding to the advice, or for neither.

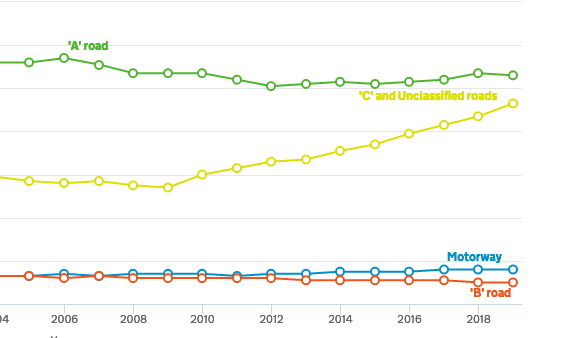
There have been many anecdotal reports of digital navigation resulting in problematic use of minor roads (‘rat running’). While traffic on A and B class roads in London has been broadly stable since the mid-1990s, traffic on C roads, which had also previously been stable, increased from 5.4 billion miles in 2009 to 9.3 billion in 2019, suggestive of substantial impact of digital navigation devices.

There is clearly a case for better coordination between satnav providers and highway authorities to optimise the impact of digital navigation for all road users and to minimise environmental harms. There is in fact a legal basis for achieving this, although it has not been put into practice. The Road Traffic (Driver Licencing and Information Systems) Act 1989 requires dynamic route guidance systems that take account of traffic conditions to be licenced by the Secretary of State. This was enacted to facilitate the introduction of a pilot route guidance system that had been developed by the Transport Research Laboratory (then part of the Department for Transport), which in the event was not taken forward. A licence could include conditions concerning roads that should not be used and information to be supplied about traffic conditions.

There is a need for a review of the impact of digital navigation on the functioning of the highway system with a view to identifying ways of benefiting road users. It is very likely that exploiting digital technologies would be far more cost effective than employing costly civil engineering technologies to increase capacity.

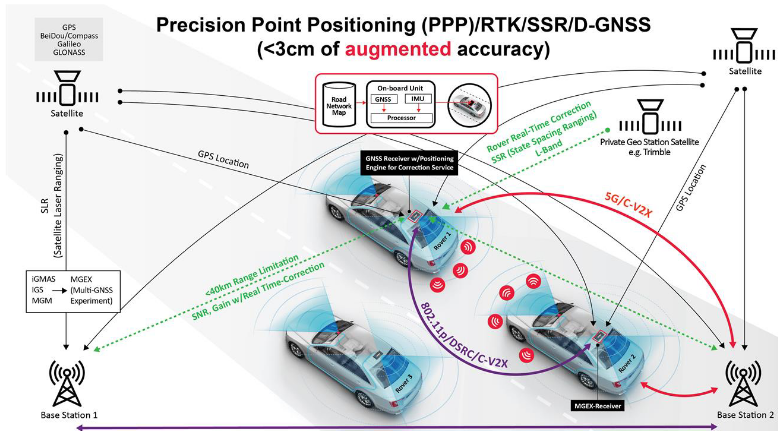
The main focus of recent interest in the area of ‘Connected and Autonomous Vehicles’ has been autonomy – driverless cars – where both tech companies and auto manufacturers are attempting to get the technology to the point where it could be used on real roads. In contrast, while the idea of connected vehicles has been around for some years, progress has been slow. There are two kinds of connectedness: vehicle-to-vehicle (V2V) and vehicle-to-infrastructure (V2I); collectively V2X. A recent US webinar and report provided some illumination.

The main motivation of V2X is to improve safety, a real issue in the US where more than 6000 pedestrians a year are killed in traffic-related incidents. The aim is to enhance visual line of sight communication by using other parts of the electromagnetic spectrum.

There are two means of connectivity: WiFi based on a dedicated short-range communications (DSRC) standard approved in 2010 but with little implementation by manufacturers; and a cellular connection (C-V2X), based on smartphone technology, which could connect vehicles directly, independent of the base stations used for normal voice calls. Initially, 4G technology is being used, with the intention to move to the much faster 5G as that is rolled out. The hope is that vehicles will also be able to sense the presence of pedestrians by detecting their smartphones. The V2I capability depends on road authorities being willing to install connectivity in traffic signals and other roadside signs, which they may be reluctant to afford.

Deployment of V2X depends on whether this is mandated by national authorities. The Chinse government is supporting C-V2X. On the other hand, EU states voted against a proposal of the European Commission to adopt a WiFi standard, and the US government has also not supported a similar approach. In the absence of a policy mandate, deployment depends on consumer demand. The VW Golf launched in 2019 has WiFi V2X connectivity. Ford is planning to introduce C-V2X in 2022.

However, consumer interest and willingness to pay for a range of driver assistance and connectivity technologies has remained lukewarm for several years, with substantial levels of ambivalence and even scepticism towards these offerings. Enhanced safety, while desirable, may be insufficient a selling point. And having two technologies in use will not help.

Apart from safety, the other potential use of V2X connectedness would be to increase effective road capacity by permitting shorter headways between autonomous vehicles. This benefit depends on the implementation of robot-driven vehicles with faster reaction times than human drivers. Shorter headways would increase the risk of crashes. Crashes involving autonomous vehicles require allocating responsibilities for fault, more difficult where V2V communication is involved between vehicles of different make under different ownership. Moreover, the benefit from increased road capacity accrues to road authorities more than to road users, so the commercial incentive to develop V2V for this purpose seems quite limited.

Altogether, the case for developing vehicles connectedness does not seem strong.

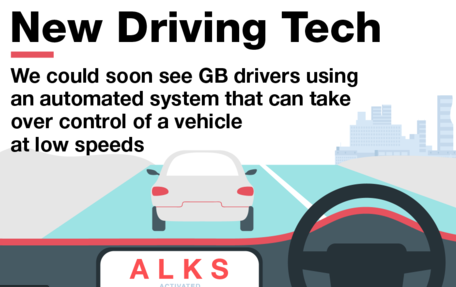
The Department for Transport (DfT) is consulting on a new aspect of vehicle automation – the Automated Lane Keeping System (ALKS) . Already available are advanced driver assistance systems that include adaptive cruise control and lane keeping, to govern longitudinal and lateral movements, respectively. Inclusion of both would amount to SAE Level 2, referring to the generally accepted categorisation of vehicle automation.

The consultation concerns a proposal to permit a move to SAE Level 3, by relieving the driver of a light vehicle of responsibility for longitudinal and lateral control at speeds of up to 60 kph (37 mph) on motorways. This would allow drivers to attend to other tasks in heavy, slow moving traffic on modern roads not used by cyclists and pedestrians.

DfT hopes that automation will make roads safer, given that 85% of road collisions in Great Britain that result in injury involve human error. However, a requirement for the operation of ALKS is that the individual does not need to monitor the vehicle if, inter alia, the vehicle can ‘avoid collisions which a competent and careful driver could avoid’ (consultation document para 3.13). Presumably, moving at low speed on a traffic-congested motorway ensures that the probability of an injury accident is very low. Hence while ALKS in these circumstances would not improve safety, it would not be likely to worsen it.

The benefits to road users of low-speed ALKS are relatively modest, and vehicle manufacturers may not think it worthwhile developing this SAE Level 3 technology, with the costs involved that would need to be recovered from sales. However, the consultation raises the possibility of ALKS operation at up to 70 mph, a speed at which fatal and injury accidents occur and where a timely and effective response of the driver to a transition demand would be essential. Doubts about the feasibility of such a response deter many developers from pursuing Level 3 technology, preferring to jump to Level 4 where there is no role for the driver in a defined environment. On the other hand, Level 3 low-speed ALKS may be easier to deploy on motorways, as a first step to autonomy, than Level 4 technology at higher speeds.

The attractions for manufacturers of low-speed ALKS may depend on the prospects for eventually offering this technology for use on motorways at all legal speeds, which would be far more attractive for intending purchasers of vehicles but more a good deal more demanding technically. It would therefore be important for DfT to indicate the likely safety requirement for all-speed ALKS. This would need to be more stringent than the ‘competent driver’ requirement, to meet both high public expectations for transport safety when individuals are not in charge of a vehicle, as well as the aim that automation should make roads safer.

The Prime Minister has announced expenditure of £2bn to kickstart a ‘cycling and walking revolution’. While this reflects his personal predilection for cycling, as was evident when he was Mayor of London, there are two pressing policy imperatives. The coronavirus pandemic necessitates reduced occupancy of buses and trains, for which cycling and walking provide healthier alternatives. And in the longer term, active travel, as it is termed, has a part to play in plans being developed to decarbonise the transport system, as well as to improve urban air quality.

Cities are promoting active travel in response to the pandemic. Manchester has committed £5m to enable socially-distanced cycling and walking.    Sadiq Khan, the current Mayor of London, has reallocated road space with the aim of increasing walking five-fold and cycling ten-fold.

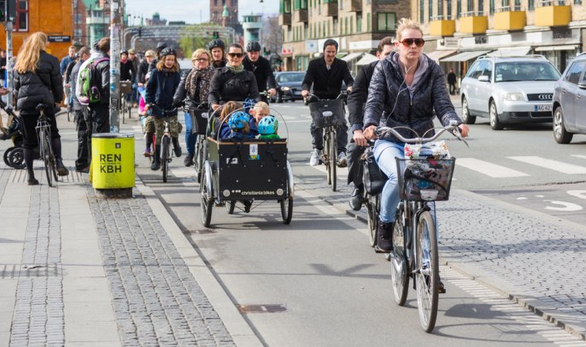
A ten-fold increase in cycling in London would take the present 2.5% share of journeys to the level found in Copenhagen, currently 28%, in a city that has excellent cycling infrastructure and a longstanding cycling culture. However, 32% of trips in Copenhagen are by car, only a little less than London’s 35%. Aside from cycling, the other big difference is public transport use: 19% of journeys in Copenhagen versus 36% in London.

This indicates that we can get people off buses onto bikes, which are cheaper, healthier, better for the environment, and no slower on congested urban streets. But it is harder to get people out of their cars, even in Copenhagen where everyone has experience of safe cycling. Features that make the car attractive include the ability to carry people and goods, including the stuff your lug around in the boot; and trips a bit long for a bike ride, or where you need to appear well dressed at the destination. And many people positively like cars and driving for feel-good reasons – witness the enormous choice of models, including the current fashion for high fuel consumption sports utility vehicles.

Cars typically are parked for 95% of the time, which makes an economic argument for those keen on sharing vehicles or journeys. But conversely, the willingness to pay substantial sums for an item used for only 5% of the time indicates the value people place on personal ownership and the mobility that this make possible.

The fundamental attraction of the car is the access it allows to people and places, opportunities and choices, at least when roads are not too congested and when it is possible to park at both ends of the journey. To achieve access to the wide range of destinations to which we have become accustomed, within the time available for travel during the busy day, the car is the most efficient mode of travel for moderate distances. If you live in a village without a car, and with limited or non-existent bus services, your opportunities and choices of work, shops and services are limited. Acquire a car and the possibilities are expanded substantially. Although there are many ideas and initiatives for replacing cars outside cities, the cumulative impact is unlikely to be transformative.

Where it is certainly possible to replace cars is in cities, where roads are congested and parking is limited. Car use in London was at its peak in the early 1990s, accounting for 50% of journeys. Subsequently the population increased while road capacity for cars was reduced to make room for bus lanes, cycle routes and pedestrian space, and at the same time there was substantial investment in rail capacity, all of which reduced car use to the current 36% of journeys. But beyond densely populated cities, the cost of urban rail is hard to justify, and buses on congested roads are not an attractive alternative to car use. On the other hand, buses on dedicated routes free of general traffic – Bus Rapid Transit – can be attractive as a lower cost alternative to rail.

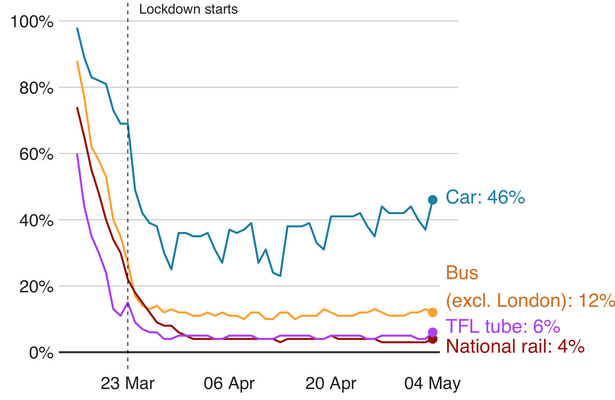
The pandemic lockdown showed how we could make substantial changes to our travel behaviour, some of which are likely to be long-lasting – less travel for commuting, shopping and on business. Yet such decreases could well be offset by increases in other kinds of trips, reflecting our need to get out of the house and engage with the wider world.

There is much uncertainty about the extent to which we can count on changing travel behaviour to contribute to transport decarbonisation and improve urban air quality. We will therefore need to rely largely on technological change, by replacing oil as the main fuel for motive power – electrification of cars, vans and most trains.

Policy to promote walking and cycling is undoubtedly worthwhile and will yield both health and environmental benefits. Yet the attractions of motorised mobility and the experience of Copenhagen suggest that the main impact will be to attract people from public transport, rather out of their cars.

This blog was the basis for an article in The Conversation on 24 August 2020

Lynn Sloman and colleagues of Transport for Quality of Life (TQL) issued a report about carbon emissions arising from the Department for Transport’s second Road Investment Strategy (RIS2). Their detailed analysis reaches the conclusion that the increase in CO2 from RIS2 would negate 80% of potential carbon savings from electric vehicles on the Strategic Road Network (SRN) between now and 2032.

This conclusion struck me as surprising. Although annual expenditure on new capital projects for the SRN has been running at over £2 billion a year, civil engineering is very costly and we don’t get much extra capacity for our money. The recent rate of addition of lane-miles to the SRN has been 0.5% a year, which is less than the rate of population growth. So how could such a low rate of addition of capacity have such a large adverse impact on carbon emissions? We need to question the TQL calculations.

TQL argues that the RIS2 road schemes will increase carbon emissions in a number of ways, particularly by increasing speeds and inducing more traffic, both of which they believe are underestimated in conventional scheme appraisal. They therefore estimate the additional cumulative carbon emissions from these sources, both put at around 6 Mt CO2 for the period 2020-2032. But I wonder if there is not some overstating here, given that more traffic would tend to reduce speeds. For instance, for a scheme to widen part of the M25, I found that outturn traffic flows were higher than forecast, such that there was no increase in traffic speed.

TQL estimate that RIS2 would increase carbon emissions by 20 Mt CO2 for the period 2020-2032, including carbon from construction. This is then compared with the difference in carbon emissions between two scenarios from the DfT Road Traffic Forecasts 2018, the Scenario 1 reference case and Scenario 7 high electric vehicle case, which amounts to a reduction of 25 Mt, hence the conclusion that the increased carbon emissions would negate 80% of the benefit of the shift to EVs.

There are, however, problems with this estimate of carbon reduction from EVs. Scenario 7 assumes no tax on EVs to replace fuel duty, so that the cost of motoring decreases substantially (by 60% by 2050), hence a projected large increase in traffic compared with Scenario 1 (50% increase by 2050 compared with 35% for the reference case). Whatever the realism of the assumption about tax, such a large increase in traffic is implausible as the consequence of electrification. Average travel time has remained constant at about an hour a day for the past 45 years at least, hence to travel further it would be necessary to travel faster, which will not happen through a change in propulsion. The problem is that the Road Traffic Forecasts derive from the National Transport Model, which does not recognise travel  time constraints.

An assumption that electrification has no effect on traffic volumes would substantially increase the scale of carbon reduction under Scenario 7, to which could be added the benefit of bringing forward the phase out of non-electric cars and vans earlier than 2040, as assumed in that Scenario. And if we reduce the additional carbon from the RIS2 programme to allow for some overstating, then we could arrive at a less pessimistic conclusion than the TQL authors about the carbon impact of this programme on future overall SRN emissions.

Nevertheless, despite these caveats, I agree with the conclusions of the TQL report that RIS2 is anachronistic, and that cancellation would free up substantial investment for better uses, not least fast broadband to lessen the need for travel, both for commuting and on business. The SRN is under greatest traffic stress in or near urban centres during the morning and late afternoon peaks, when car travel to and from work interferes with long distance road users. The economic case for road investment needs to be reconsidered in the light of changes in daily travel prompted by the pandemic.

I previously noted publication by the Department for Transport of its Second Road Investment Strategy (RIS2). DfT has now issued an economic analysis that concludes that the new programme represents high value for money. I had hoped that this document would provide substantiation of the £27 billion, 5-year road investment programme but I was disappointed.

The summary states that overall RIS2 is High Value for Money, meaning £2 return for every £1 spent (Benefit-Cost Ratio of 2). Yet new commitments of major capital enhancement schemes yield a BCR of 1.5, which is unimpressive. The analysis is minimal, offering no breakdown into individual schemes, where some might be expected to have a BCR of 1 or less if the average is 1.5.

These estimates are based on the now rather dated Road Traffic Forecasts published in 2018, which included five distinct scenarios, yet no indication is given as to how the BCR would vary with scenario. The estimates are also derived from new but unpublished regional traffic models, asserted to be ‘world leading’.

I previously pointed out a major discrepancy between traffic forecasts and post-opening outturn for the smart motorway widening of the M25 between Junctions 23 and 27. These forecasts were generated by a regional model of the kind now in general use by Highways England, based on SATURN software that originated in the 1980s. The purpose of these models is to estimate travel time savings that arise from adding carriageway, which feed into an economic model. Yet in the M25 case, no time savings were observed beyond year 1 after opening, putting the validity of such models  in doubt.

The new DfT analysis frequently asserts that its analysis is robust (15 times, in fact), which is usually a sign of intellectual insecurity. In fact, the analysis is pretty thin and seems intended to justify a road construction programme developed in earlier era, before we have had a chance to assess the impact of the coronavirus pandemic and what this might mean for travel demand and for public expenditure priorities, urban vs. inter-urban transport vs. broadband.

An on-line meeting organised by Local Transport Today on 19 June was concerned with the future of car travel after the coronavirus pandemic. I contributed the following thoughts.

The average distance travelled by car in the UK per person ceased to grow at turn of century, following strong growth in the last century. This phenomenon has been called ‘Peak Car’, but ‘Plateau Car’ would be a better term, given the 20-year flat trend. But with the coronavirus pandemic, we have three new influences that could affect the trend of car use in the longer run.

First, a natural preference for the car in place of public transport during the pandemic, which will add to road traffic congestion. Second, less road space for cars in urban areas to allow more room for active travel, both as response to the pandemic and to promote longer term reduction in carbon emissions and improve urban air quality; this also will tend to increase congestion, unless car users could be persuaded to switch to active modes. Third, less car travel due to more working at home, more video-conferencing, and more on-line shopping, accentuating recent trends; this would relieve congestion. We can’t yet estimate the likely magnitude of these influences, so can only speculate in broad terms how they may play out.

Might active travel substitute for some car use? The London Mayor aims to increase cycling 10-fold. That would take mode share to 30%, as Copenhagen, a city with comprehensive cycling infrastructure. Yet car use in Copenhagen only slightly less than in London, while public transport use half that in London – 18% mode share vs 37% in London.

It seems that people can be attracted off buses onto bikes, which are cheaper, healthier, environmentally better, and no slower in congested traffic. Yet this would reduce fare income to public transport and likely the level of service. In contrast, it seems harder to get people out of cars onto bikes, even in Copenhagen where most motorists have bikes at home.

The fundamental problem in getting people to travel by slower modes is the consequent reduction in access. The key historic transport innovations all increased access. Railways, the modern bicycle, motor car, motorised two-wheelers, each offered a step change increase in speed of travel and hence in access to people, places, opportunities and choices. Access increases with the square of the speed of travel. Comparing walking at 3 mph with urban car travel at say 20mph, a 7-fold increase in speed, yielding a 50-fold increase in access to desired destinations. Comparing cycling at 10mph with car travel – twice the speed giving four times the access. People have become used to the access offered by the car and most would be reluctant to settle for less by opting for slower modes.

To reduce car use, we need to offer a mode that is faster and more reliable than the car on congested roads, which is rail – interurban between cities, commuting into cities, and rail in all its forms within cities. Investment in rail in London has been important in reducing car mode share from 50% in early 1990s to the current 36%. But continuation of that shift depends not only on successfully tacking the coronavirus pandemic, but also continuing to invest in urban rail, which is very costly and so limits expansion of rail travel.

The other way of reducing car use is to lessen the need to travel for work. The pandemic has shown us how we can manage to travel much less, but this is undoubtedly suboptimal. The magnitude of the rebound remains to be seen. Investment in broadband could facilitate remote working and could be much more cost-effective than new road capacity.

 All in all, I do not expect to see a substantial change in per capita car use nationally, once the pandemic is behind us, but we could be at the start of a downward trend, reflecting less need to travel and some switching to other modes. It may turn out that we are now at the peak of car travel on a per capita basis, which should prompt review of all those ‘shovel ready’ schemes in the road construction programme.

As a means to decarbonise the transport system, the contribution of behavioural change is problematic to rely on because of the uncertainties of responses to both the easing of lockdown restrictions and policy interventions aimed at changing travel behaviour. This means that we need a strong commitment to technology in the form of electrification, both to cut transport carbon emissions and improve urban air quality.

The other new technology – automation – is not a solution to the problems we face. It will be difficult to deploy autonomous vehicles on the existing road network. The technology is expensive and the benefits limited, so that the appetite of consumers is uncertain. The car manufacturers will give priority of electric vehicles, leaving automation to be developed in the slow lane.


The Department for Transport recently issued a report concluding that the Second Road Investment Strategy (RIS2) represents high value for money. One might have thought that this 29-page RIS2 Analysis Overview would porvide substantiation of the £27 billion, 5-year road investment programme announced earlier. We are disappointed.

The summary states that overall RIS2 is High Value for Money, meaning £2 return for every £1 spent (Benefit-Cost Ratio of 2). Yet new commitments of major capital enhancement schemes yield a BCR of 1.5, which is unimpressive. The analysis is minimal, offering no breakdown into individual schemes, where some might be expected to have a BCR of 1 or less if the average is 1.5.

These estimates are based on the now rather dated Road Traffic Forecasts published in 2018, which included five distinct scenarios, yet no indication is given as to how the BCR would vary with scenario. The estimates are also derived from new but unpublished regional traffic models, asserted to be ‘world leading’.

I previously drew attention to a major discrepancy between traffic forecasts and post-opening outturn for the smart motorway widening of the M25 between Junctions 23 and 27. These forecasts were generated by a regional model of the kind now in general use by Highways England, based on SATURN software that originated in the 1980s. The purpose of these models is to estimate travel time savings that arise from adding carriageway, which feed into an economic model. Yet in the M25 case, no time savings were observed beyond year 1 after opening, putting the validity of such models  in doubt.

The DfT report frequently asserts that its analysis is robust (15 times, in fact), which is usually a sign of intellectual insecurity. In fact, the analysis is pretty thin and seems intended to justify a road construction programme developed in earlier era, before we have had a chance to assess the impact of the coronavirus pandemic and what this might mean for travel demand and for public expenditure priorities, urban vs. inter-urban transport vs. broadband.