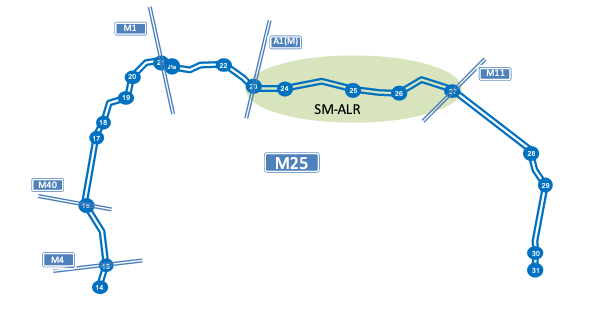
Smart Motorways, a flagship programme of Highways England, aims to relieve congestion by converting the hard shoulder into a running lane and by varying the speed limit to smooth traffic flow. To assess performance in practice, Highways England has been monitoring closely the section of the M25 between Junctions 23 and 27 since the widened road opened in 2014. Three annual reports have been published, detailing traffic flows, journey times and safety, and comparing outcomes ‘before’ construction and ‘after’ scheme opening. Traffic growth of 16% was observed at Year 3 compared with before opening, far higher than regional motorway growth over the same period, with increases in weekend traffic of up to 23%.
Such traffic growth seems a noteworthy example of induced traffic, the traffic that arises as a result of increased capacity and which tends to restore congestion to what it had been previously. I therefore made a Freedom of Information request to see the traffic forecasts and economic appraisal that were the basis of the investment decision.
The traffic forecasting report was based on a variable-demand multi-modal model for the M25 area, employing the SATURN suite of programmes, updated to take account of the most recent national datasets for trip ends and similar. Traffic forecasts were made for the assumed 2015 scheme opening year, the 2030 design year and the 2040 horizon year, for the morning and evening peak flows and the interpeak period, comparing the ‘do-minimum’ case, without the investment, and the ‘do-something’ case with it.
The time slices used for the forecast and the outturn monitoring are regrettably different, which limits comparisons at particular times of day. Comparisons may, however, be made of average daily traffic flows (ADT). For the section J23-24 clockwise, for instance, the forecast ADT increase, comparing the scheme with do minimum, was 13% in 2015 and 16% in 2030. The outturn monitoring found an increase of 13% at Year 3 after opening compared with before, in good agreement with forecast.
The economic appraisal report employs the DfT’s TUBA software to derive estimates of monetarised travel time savings and vehicle operating costs (VOC) from the traffic forecasts, comparing do-something and do-minimum cases. The main economic benefit is travel time savings to business users, worth £475m, because the scheme was expected to allow travel at higher average speeds than the do-minimum case. Time savings to non-business travellers (commuters and others) were very largely offset by increased VOC, given the assumed diversion from local roads onto the motorway generating longer trips. As an example of the origin of the time savings, the speed on J23-24 clockwise for the AM peak in 2015 was forecast to be 86 km/hr with the scheme, versus 76 km/hr without. The overall benefit to cost ratio (BCR) was 2.3, later adjusted upwards to 2.9.
However, this forecast increase in speed failed to materialise. There has been effectively no change on average for all days and time slices between before opening and Year 3 for the clockwise travel. For anticlockwise, an average saving of 15 seconds (1.4 per cent) was found for a journey of 16.6 min before the improvement. Time savings of 6% and 9% respectively were seen at Year 1 after opening, but were lost by Year 2.
Generally, traffic flowed at the free flow rate except during the PM peak when it was slower. Surprisingly, the extra lane did not permit a faster flow at this PM peak, even though the increase in capacity of 33% was greater than the increase in traffic volume. Possibly the use of variable speed limits to smooth the flow was at the cost of journey time savings.
The stated conclusion of the Year 3 monitoring report is that ‘increases in capacity have been achieved, moving more goods, people and services, while maintaining journey time at pre-scheme levels and slightly improving reliability.’ Yet this conclusion undermines the economic case for the scheme, based on forecast time savings. This in turn raises questions about both the validity of the modelling and of the orthodox approach to appraisal.
We know from the National Travel Survey that average travel time has remained essentially unchanged for at least the past 45 years. This implies that any travel time savings must be short run. In the long run, people take advantage of transport investments that permit faster travel to gain access to more distant destinations, services, opportunities and choices, within the limited time they allow themselves for travel. This change in travel patterns would first be seen in optional trips, consistent with the big increase in weekend traffic in the M25 example, and subsequently over the years as people move home and change jobs. The consequential additional traffic – induced traffic – adds to congestion and negates the time savings that are conventionally supposed to be the main economic benefit.
If we are to make transport investments that are good value for money, we need to pay attention to the real-world consequences, and not be misled by the outputs of models that generate the notional time savings to which transport economists are so attached. We need to constrain models to hold average travel time constant in the long run, consistent with the findings of the National Travel Survey. To calibrate models, we need data on origins, destinations and purposes of trips, and how these change when a road is widened. And we need to work out how to value access benefits to users.
This blog is based on an article published in Local Transport Today 24 May 2019

