The Office of Rail and Road has extensive responsibilities for regulating the largely private sector rail industry but quite limited oversight of public sectors roads. The Department for Transport is planning its third Road Investment Strategy investment programme (RIS3). The ORR has been consulting on its role in relation to RIS3. Essentially, the ORR sees its role as ensuring that National Highways (formerly Highways England) achieve value for money in implementing the DfT’s investment priorities.

The ORR consultation document states that it is not the role of the ORR to set roads policy or determine investment priorities. However, it is a shortcoming of the ORR’s approach that it does not consider to what extent the investments agreed by government achieve the benefits to road users that are expected. This is a major gap in public oversight.

The National Audit Office from time to time evaluates benefits to users of road investment, for instance its 2019 report on improvements to the A303. But NAO oversight is occasional, not systematic.

Detailed analysis of the outcomes of road investment may show major discrepancy between forecast and outturn, for instance for widening the M25 between junctions 23 and 27. One general explanation is the underestimation of the scale of induced traffic . Induced traffic reduces travel time savings, supposed main economic benefits of investment, which is why transport models tend to underestimate its magnitude.

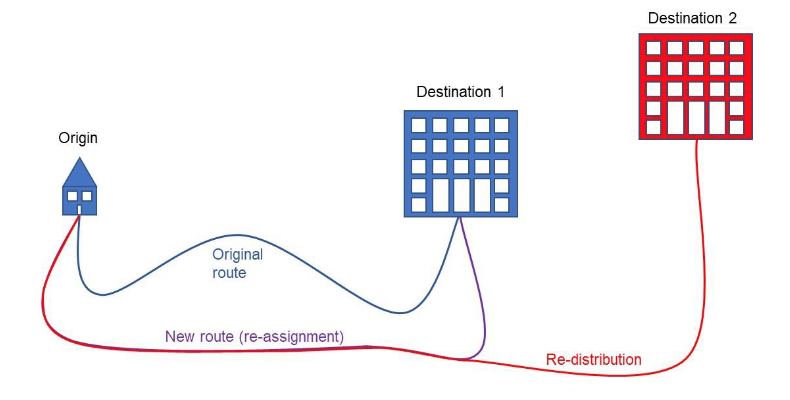
One source of induced traffic is the rerouting of local trips, such as commuting, to take advantage of faster travel on widened motorways, pre-empting capacity intended for business users and so undermining the economic case for widening. This is likely to be a general phenomenon in or near areas of high population density, where the strategic road network comes under greatest stress, and where the case for additional capacity seems strongest.

More generally, average travel time, as determined in the National Travel Survey, has remained essentially unchanged for half a century, during which time huge sums have been invested in road infrastructure justified by the saving of travel time. Travel time savings are short-run. In the longer run, over the greater part of the life of the assets, the main benefit of investment that allows faster travel takes the form of increased access to people and places, opportunities and choices.

All in all, there is reason to suppose that the outcomes of road investments may be substantially different from that forecast by the traffic and economic models in use, and that road users are not benefiting from investment in new capacity to the extent intended. The ORR should take on the task of ensuring that road investment appraisal methodologies are fit for purpose.

Induced traffic is the additional traffic that arises from investment to increase road capacity. The usual reason to increase capacity is to relieve congestion. The intended outcome is that journeys are faster and easier. Yet this can lead to more frequent or longer car trips, changes to route or destination, or mode switching from public transport. All these changes lead to more traffic on the network.

The problem with induced traffic is that the more of it there is, the less the savings in travel time, which are treated as the main economic benefit of investment. So, the magnitude of induced traffic is of interest, prompting the Department of Transport to commission a study by consultants WSP and RAND Europe of options to improve its measurement. Two broad approaches were identified: econometric analysis that quantifies the relation between road capacity changes and observed traffic levels over time; and Before and After (B&A) studies that compare traffic before and after particular interventions.

The disadvantage of the econometric approach is that it generates an aggregate measure that does not indicate the components of induced traffic. B&A studies are more illuminating and could be improved by use of mobile phone network data (MND) to quantify changes to travel behaviour. MND allows an understanding of origins and destinations of trips, before and after an intervention. Large samples of road users are available, which would enable distinction to be made between the various kinds of change in travel behaviour. Transport for London has developed a multi-modal strategic transport model that estimates demand from MND.

One possibility not considered in the WSP/RAND study would be to carry out a sample survey of users of the road network, before and after an intervention, identifying changes in travel behaviour over time. This could employ seven-day travel diaries as for the National Travel Survey, or GPS to track travel patterns via a smartphone app. Studies of this kind, known as longitudinal studies, are well established in medicine and the social sciences. Much current research into the impact of Covid-19 is longitudinal, for instance following the immune response to vaccination over time. However, longitudinal studies of travel behaviour are rare, although they have the potential to understand the impact of investments in far more illuminating detail than is possible with conventional before and after traffic counts. 

The WSP/RAND study concludes that all components of induced travel can be represented in the standard four-stage transport model, except that arising from changes to land use, which may have a substantial impact. However, the study did not consider the implications of induced traffic for the economic analysis of road investments, which routinely employs the output of a traffic model (including induced traffic effects) as input to an economic model. This is usually the DfT’s TUBA model, which generates monetary values of the time savings and other benefits/disbenefits. The net present value of the benefits is then compared with the investment costs to yield a benefit-cost ratio, important for investment decisions.

The phenomenon of induced traffic was recognised in a landmark 1994 report by the Standing Advisory Committee on Trunk Road Assessment (SACTRA). It is remarkable how little progress has been made in understanding its origins and incorporating this into modelling and economic appraisal. A cynic might say that this is because induced traffic undercuts the economic case for a road investment where the main benefit is supposed to be travel time savings, and so is yet a further headwind for the DfT’s £27 billion road investment programme. My own analysis of the widening of the M25 J23-27 showed that induced traffic, largely arising from rerouted local trips, was substantially greater than forecast and wiped out the economic benefits expected to accrue to longer distance business users. This is likely to be typical of investment to add capacity near densely populated urban areas where local commuters and others compete for road space with long distance business users. Standard traffic models are biased against fully recognising induced traffic.

The concept of induced traffic as an aggregate measure is now obsolete. Instead, we need to focus on how travel behaviour actually changes as the result of an intervention, and then work out how to value those behaviour changes. If an investment allows travel time to be saved, then monetary value can be ascribed according to established methods. However, we lack methodology for valuing longer trips to more distant destinations, motivated by the greater value of access to goods or services. Increased access is the real benefit of transport investment.

The above blog post was the basis for an article in Local Transport Today 836, 16 December 2021.

Inrix, a firm that analyses road traffic, recently reported average delays in London due to congestion in 2021 of 148 hours, twice the national average, but virtually the same as in 2019, before the pandemic. This prompted debate about the impact of the increase in cycle lanes put in place in London in response to Covid-19.

To make sense of what is happening, we need to recognise that our availability of time always constrains the amount we can travel. There are many activities that we need to fit into the 24 hours of the day, and on average we spend just an hour on the move. This limits the build-up of congestion.

Road traffic congestion arises in areas of high population density and high car ownership where is not enough road space for all the car trips that might be made. If traffic volumes grow for any reason, delays increase and some potential car users make other choices. We may change the timing or route of a car journey, or the travel mode where there are alternatives available, or a different destination such as an alternative shopping centre, or not to travel at all, for instance by shopping online.

So, if road space is taken away from cars in order to create cycle or bus lanes, then initially congestion will increase. But the additional delays will induce some car drivers to make alternative choices and congestion will revert to what it had been. The overall impact is to reduce the share of trips by car, which is what has been happening in London for many years as the population has grown and as there has been large investment in public transport, with less road space for cars: private transport use fell from 48% in 2000 to 37% in 2019, while public transport use grew from 27% to 36% over the same period. Cycling increased from 1.2% to 2.4% while walking held steady at 25%.

The London Mayor’s transport strategy ambitiously aims to cut private transport use to 20% of all trips by 2041. This would be expected to diminish the total amount of traffic congestion, although not necessarily its intensity at peak times in the busiest areas.

Creating cycles lanes reduces the space available for cars but in itself it does not get people out of their cars. Copenhagen is a city famous for cycling, with 28% of journeys made by bike. Yet car traffic is only slightly less than in London. Aside from cycling, the other big difference is that public transport accounts for only half the proportion of trips compared with London.

The experience of Copenhagen indicates that we can get people off buses onto bikes, which are cheaper, healthier, better for the environment and no slower in congested traffic. Yet buses are an efficient way of using road space to move people in urban areas, with diesel engines being replaced by electric or hydrogen propulsion to cut carbon emissions. We would like to get drivers out of their cars onto bicycles, yet this has proved difficult, even in Copenhagen, a small flat city with excellent cycling infrastructure and a strong cycling culture.

Looking across a range of European cities, we find very diverse patterns of journeys by the different travel modes, reflecting, history, geography, size and population density. But we do not find cities with high levels of both cycling and public transport. So, the prospects for a substantial increase in cycling in London are far from certain, given the relatively high level of past public transport use.

The pandemic has had a major impact on public transport use in London, with bus and Tube journeys currently at only 70-75% of pre-pandemic levels. The financial consequences have been severe. Transport for London may have to embark upon a ‘managed decline’ scenario unless more support from the government is forthcoming.

In such circumstances, further investment in new rail routes would not be possible and existing services would be reduced. Investment in cycling would then be the most attractive way of implementing the strategy of reducing car use in London, both by encouraging cycling as an alternative and by lessening the scope for people to drive.

The above blog post was the basis for an article in The Conversation on 9 December 2021.

The switch to electric vehicles (EVs) will result in the loss of revenue from road fuel duty, as is generally recognised. This prompts the question of whether to replace fuel duty with a charge for use of the roads, as many have suggested. This issue was ducked in the recent Transport Decarbonisation Plan from the Department for Transport, but it won’t go away.

The general replacement of road fuel duty, collected from the oil companies, by a charge collected from many millions of road users, would be a formidable undertaking. My suggestion is that this happens in stages.

First, it should only be EVs that pay a road user charge, the rationale being that they need to contribute to the costs of maintaining and operating the road network in the way that drivers of conventional vehicles do via fuel duty. But while the capital costs of EVs are higher than those for comparable internal combustion engine vehicles, it would be necessary to retain lower untaxed running costs to incentive uptake. However, it is expected that the purchase prices of EVs will fall as battery costs continue to decline. Road user charging for EVs could be introduced once purchase prices of EVs and conventional vehicles are similar.

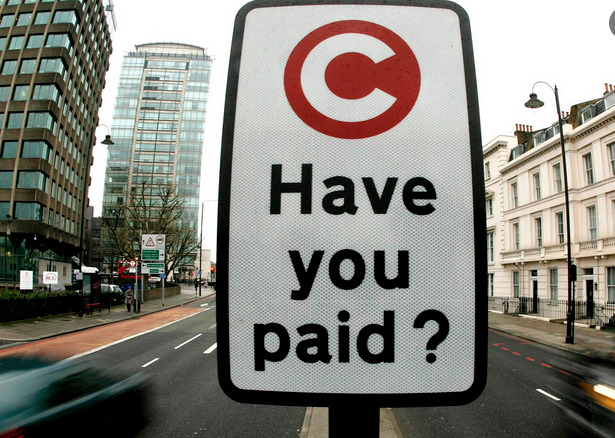
Second, it would be sensible to stage the adoption of road user charging spatially by starting in London. The congestion charge in London has been operating successfully for nearly twenty years. The technology works, useful revenues are generated to support public transport, and the system is publicly acceptable, with no significant concerns about privacy despite the ubiquity of enforcement cameras. The technology has been used to charge older polluting vehicles, initially in the congestion charging zone, and subsequently within the area bounded by the North and South Circular Roads.

The London congestion charge system levies a daily charge on entry to the charging zone, subject to a variety of exclusions. A more flexible system would be needed for EV user charging. The first step might be to migrate the charging mechanism to a smartphone app, which knows where it is in time and space and so knows if it is subject to user charging. The app would need to know in which vehicle it is located since enforcement of the charging system depends on automatic number plate recognition by fixed cameras.

The incentive for users to migrate to their smartphones would be a reduced daily charge, compared with the present £15. Then it would be possible to flex the charge, for instance to reflect duration in the charging zone, or whether at times of peak use or location within the zone. Such flexing should be publicly acceptable if charges never exceed the standard daily charge. Experience would be gained of how road users respond to varying charges. The congestion charging could be extended beyond the present central zone if that seemed useful to manage traffic and was publicly acceptable.

Once a flexible charging scheme had been proven in London, it could be adopted by other cities that wished to manage traffic and raise revenue to fund public transport and active travel, subject to electorates being willing. Once the charging scheme had been adopted by a number of cities for the generality of motorised vehicles, it could be extended nationally to EVs. Charges would then have two elements: that levied by the local road authority and that levied by central government. There would be scope for local authorities to vary charges to meet local needs, for instance to generate more revenue to fix potholes, or, more ambitiously, to deter car use in town centres and subsidise public transport. More generally, an appropriate apportionment of road user charging between local and national government would facilitate devolution of responsibilities for transport to localities.

I have an article published in Highways Magazine, the text of which is below.

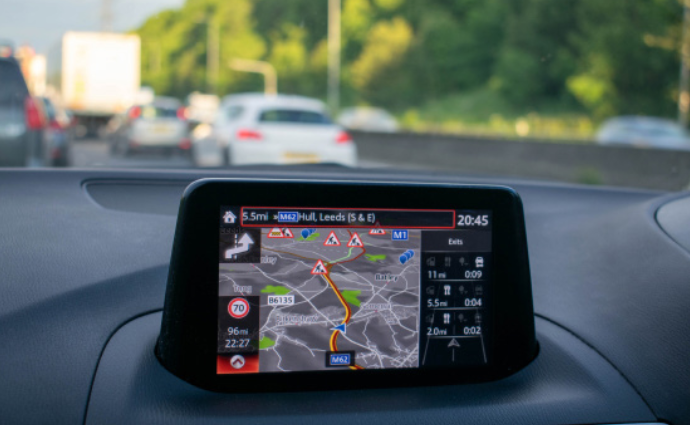
Recent advances in a number of digital technologies in combination are having a significant impact on travel behaviour on the road network by providing route guidance that takes account of traffic conditions. What may be termed ‘digital navigation’ involves the use of satellite navigation (satnav) to provide spatial positioning to high precision; digital mapping; the ability to detect vehicle speeds and hence the location of traffic congestion; and routing algorithms to optimise journeys. The combination of satnav location and digital mapping provides a navigation service that offers turn-by-turn route guidance.

While digital navigation is in widespread use by road users, remarkably little information is publicly available about performance, in particular how routes are optimised, the suitability of recommended routes, the accuracy of estimated journey times, and the impact on the functioning of the road network as a whole. Nevertheless, there is evidence to indicate an impact on the use of minor roads, of major roads, and on traffic congestion and the optimisation of the road network.

Recent revisions to British road traffic statistics appear to show that there has been a substantial growth of motor vehicle traffic on minor roads in recent years, an increase of 26% between 2010 and 2019, while traffic on major roads increased by only 12%.  One factor contributing to this growth is the increase in van traffic, including that arising from the growth of online shopping with home deliveries. However, in 2019 van traffic amounted to 15% of traffic on urban minor roads, and 19% on rural minor roads, cars being responsible for 82% and 78% of traffic respectively. So, the growth of van traffic on minor roads has been responsible for only part of the overall traffic growth on these roads.

The most likely main contribution to the large growth of traffic on minor roads is the widespread use of digital navigation, which makes possible the general use of minor roads that previously were largely confined to those road users with local knowledge, as well as extending such local knowledge. Diversion to minor roads is likely to occur when major roads are congested and represents an effective increase in the capacity of the road network, so generating additional traffic.

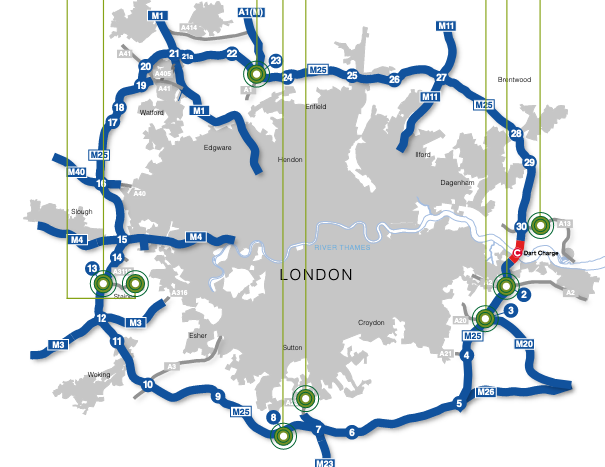
As well as encouraging use of minor roads, digital navigation may divert traffic from local roads to roads intended for longer distance traffic. One case that I have analysed where such diversion may have occurred is the widening of the M25, the London orbital motorway, between junctions 23 and 27 to the north of the city. There was substantial growth in traffic above the level that had been forecast, much of which arose from diversion of local trips, such as home to work, to take advantage of faster travel on the motorway, despite the greater distance and higher fuel costs incurred. The contribution of digital navigation in facilitating such diversion cannot be inferred from available data, but it is plausible. Regular users of digital navigation would have up-to-date information for each journey, while irregular or non-users would likely be aware that diversion to the motorway would offer the fastest journey.

The M25 case study suggests that local traffic may be expected to take advantage of the capacity increase of major routes in the vicinity of urban areas that generate much traffic, which are the locations where the Strategic Road Network is under greatest stress and where investments to increase capacity are thought to be most needed. However, this local traffic negates the benefits expected for long distance road users and so undermines the economic case for the investment. The growing use of digital navigation would tend to contribute further to weakening the case for such investment.

While the M25 case study is an illustration of the maxim that we can’t build our way out of road traffic congestion, nevertheless the development of digital navigation offers probably the best means available to mitigate the impact of congestion. Congestion arises in or near areas of high population density and high car ownership, where the capacity of the road network is insufficient to cope with all the trips that might be made. Drivers are deterred by the prospect of time delays and so make other decisions – to travel at a different time, by a different route, by a different mode, to a different destination (where there are options, as for shopping), or not to travel at all (by shopping online, for instance). Congestion is therefore substantially self-regulating, in that if traffic increases, delays worsen and more potential users are deterred on account of the time constraint.

Digital navigation that takes account of congestion in real time can offer less congested routes, so making better use of the existing road network and reducing road users’ exposure to congestion. One problem that may arise is that traffic may be diverted on to unsuitable roads, where local environments and neighbourhoods may be adversely affected, or even where large vehicles can become obstructed. Diversion onto unsuitable routes is a problem that could be mitigated through collaboration between digital navigation providers and road authorities.

Beyond the rerouting of traffic to less congested roads, there is a feature of digital navigation that mitigates the unwelcome experience of traffic congestion – the prediction of journey time, or estimated time of arrival (ETA). When road users are asked about their experience of congestion, both in surveys and in discussion, the evidence from their responses indicates that the uncertainty of journey time is a more important adverse consequence than lower speed. Accordingly, an important benefit of digital navigation is the forecast of ETA in the light of prevailing traffic conditions on the selected route, in this way substantially reducing journey time uncertainty.

While diversion onto less congested routes may be helpful for users of digital navigation, there is a question as to whether this is optimal for users of the road network as a whole. Digital navigation employs proprietary algorithms whose performance is difficult to assess externally. An algorithm might response to build up of congestion by diverting all traffic to a single alternative route until that became congested, repeating the process to spread traffic across available routes until congestion abated. Or the algorithm might spread traffic across all available routes at the outset. And the algorithm might anticipate the build-up of congestion based on historic experience. But in any event, the routing algorithm used by one provider would not take account of the activities of another provider. The providers of digital navigation services are very secretive and there is almost no published information on their design and performance.

The road system is generally well regulated to achieve safety and efficiency. Given the potential scale of impact of digital navigation devices on network operations, arguably a licensing regime would be appropriate for providers. This might require information to be exchanged with road authorities, guidance to be accepted to avoid adverse environmental and social impacts, and mutual collaboration to optimise the operational efficiency of the network as a whole, while at the same time optimising the experience of individual road users.

This blog post is the text of an article in Local Transport Today.

Cycling is widely advocated as a desirable means of travel – healthier, cheaper, more environmentally friendly and barely slower than the car for short-to-medium length trips. The Government seeks a step-change increase in cycling with £2 billion new funding, as a cost-effective way of reducing transport carbon emissions.

Certainly, there is substantial scope to increase cycling by investment in better infrastructure, witness Copenhagen with dedicated cycle lanes on all major roads, where 28% of all trips are by bike, compared with 2.5% in London. So when, at the outset of the pandemic, the Mayor of London announced his ambition to increase cycling by tenfold, you could see that this should be possible with the requisite investment. However, when you’re in Copenhagen, you are aware of the considerable amount of general traffic (and viewing Scandi noir crime dramas set in that city, you see very few of the characters using a bike). In fact, with 32% of all trips by car, Copenhagen is only slightly less car-dependent than London with 35%.

Aside from cycling, the other big difference between these two capital cities is that public transport use in Copenhagen is only half that of London, 19% versus 36% of trips. This indicates that you can get people off the buses onto bikes, but that it is much harder to get them out of their cars, even in a small, flat city with excellent cycling facilities where almost everyone has experience of safe cycling. Yet we don’t want to diminish the use of buses, which are an efficient means of moving people in urban areas, the diesel engines of which can be replaced by electric or hydrogen propulsion. Fewer bus passengers mean less fare revenue and less frequent services.

Data for other European cities indicate that Amsterdam is similar to Copenhagen, with 32% of trips by bike and 17% by public transport. In marked contrast, both Zurich and Vienna have excellent public transport responsible for 40% of trips, with cycling accounting for only 7-8%. More generally, while the pattern of urban travel reflects both local geography and history, we don’t find cities in developed economies with high mode shares of both cycling and public transport.

In seeking to reduce transport carbon emissions, we should be careful not to underestimate the attractions of the motorcar, which is useful for longer journeys and for shorter trips with less sweat, for carrying people and goods, including child seats and the stuff left permanently in the boot. The car is well-suited for meeting our needs for access to people and places, for door-to-door travel where there is road space to drive without unacceptable congestion delays and the ability to park at both ends of the trip.

But there is more to car ownership than the ability to go from A to B. The growth in popularity of SUVs suggest that there are feel-good factors that motivate purchase of these costly vehicles (it would be interesting to see the findings of the market research carried out by the car manufacturers, regrettably proprietary). The fact that cars are generally parked for 95% of the time is a good economic argument for car sharing. But conversely, this also indicates the value we place on individual ownership, to have vehicle available when we want it, a vehicle that reflects our personal consumer preferences. Cars are not unique in this respect. My washing machine sits unused more than 95% of the time. I could share with others at the laundrette, but it’s more convenient to have my own.

Car sharing in its various forms is advocated as a means to reduce car use, road traffic congestion and carbon emissions. Sharing has been facilitated by online digital platforms, which have been transformative of many aspects of the economy. For travel, we have the disruptive impact of ride-hailing as exemplified by Uber, and of online booking of trips by rail and air. By contrast, the growth of car sharing has been relatively slow, indicating the development of niche markets, with substantial replacement of private ownership looking unlikely.

Where road capacity limits car use in city centres, both public transport and active travel are attractive alternative modes. Agglomeration economics have led to increased population density in successful cities, which shifts travel away from the car. The growth of higher education in urban centres has contributed to reduced car use by young adults.  However, these trends may weaken post-Brexit and post-Covid. And while car use can be impeded in low traffic neighbourhoods in favour of cycling and walking, the aggregate impact may not be great.

We need to be careful to avoid optimism bias when projecting the impact of measures to reduce transport carbon emissions. The models that are used for this purpose are complex and opaque, with many input assumptions and parameters to be specified. Optimism bias arises when modellers make choices, consciously or unconsciously, that tend towards achieving a strategic purpose. Yet optimism bias leads to outcomes that fall short of those that are forecast. 

It is now part of the culture of transport planning to place emphasis on the opportunities for promoting cycling. But caution is needed. When addressing the impact of changing mode share, attention should be paid to the modes from which the shift to cycling is expected. For instance, the well-established Propensity to Cycle Tool, which assesses the potential to increase the amount of cycling, assumes that commuters are equally likely to shift to cycling from any prior mode. However, the evidence from Copenhagen and elsewhere indicates that a shift to cycling from public transport is much more likely than from car use, which would substantially reduce the carbon reduction benefits assumed from boosting cycling.

If optimism bias informs assumptions about mode shift from cars to bikes, or about the scope for car sharing, then disappointment is likely to ensue.

The House of Commons Transport Committee is holding an inquiry into zero emission vehicles and road pricing. I submitted evidence set out below.

Main points

  • There is a case for road pricing both to replace fuel duty revenues lost as ZEVs replace conventional vehicles and to help manage road traffic congestion.
  • The charge for road use might comprise two elements: one generating a revenue stream for the Exchequer and another for the local authority, which would allow substantial devolution of responsibilities for transport provision.
  • There would be attractions in the incremental introduction of national road pricing, building on the successful congestion charging arrangements in London.

Rationale for road pricing

The move to ZEVs will result in the loss of revenue from road fuel duty, as well as from VED were ZEVs to remain zero rated. Revenue from the former amounts to some £28 billion a year and from the latter some £6 billion. This prompts consideration of some form charging for road use to make up the loss.

The case for zero VED for electric vehicles (EVs) is to incentivise their uptake, a reason that will become irrelevant as the capital cost of EVs falls and as sales of new conventional vehicles are phased out. So, in due course VED could be applied to road vehicles generally, and if set at a rather higher rate could cover the annual cost of capital and current expenditure on national and local roads of £8 billion, obviating the need for road pricing to ensure that drivers pay for the roads they use.

One argument some make for road pricing is that without fuel taxation or a similar charge related to distance travelled, the running costs of EVs would be substantially lower than that of conventional vehicles, which would result in more miles travelled and thus more congestion, carbon emissions and other externalities. One scenario of the Department for Transport’s (DfT) 2018 Road Traffic Forecasts illustrates this expectation[1]. However, in recent years the average distance travelled by car has remained stable, being limited by the time available for travel, the speed of travel and the proportion of households owning cars, none of which have increased in this century. It is therefore not to be expected that the replacement of the internal combustion engine by the electric motor would have much impact on vehicle use.

Another argument for road pricing is to alleviate road traffic congestion, the intention of the London congestion charge. Experience has shown that reduction of congestion is quite limited at the level of charging typically employed, particularly in a prosperous city like London where many are able to afford the charge[2]. Charging for road use benefits those who can readily afford to pay by displacing those who are less able, generating increased inequalities in use of the road network that historically has been a relatively egalitarian domain. Nevertheless, congestion relief is in principle a possible aim of the road pricing regime, although the magnitude of the charge would need to reflect both the level of congestion and affordability in the locality if congestion is to be effectively ameliorated. Related to this is charging polluting vehicles, as in London’s Ultra Low Emission Zone (ULEZ), the rationale for which will diminish over time as EVs are increasingly used, yet which may remain relevant in respect on non-tailpipe particulate releases from vehicles.

Revenue from the London congestion charge and the ULEZ are retained by the city authority, as are charges for low emission zones planned elsewhere, ring-fenced for expenditure on transport services, and likewise revenues from parking charges. A national scheme for road user charging might comprise revenues both for the Exchequer as well as for local authorities, the latter setting levels of charges to reflect local conditions, including congestion and other environmental impacts of traffic, as well the need for revenues for road maintenance. There would be attractions in allowing local authorities to set their share of the road user charge to cover the full cost of local transport provision, obviating the need for grants from the DfT (other than perhaps for ‘rebalancing’ purposes). The Exchequer element of the charge could depend on the type of road, for instance higher for motorways that are funded nationally, and could vary by region to aid ‘rebalancing’ policies.

Introduction of road pricing

There would be attractions in introducing road pricing for EVs alone, on the rationale that they should pay their fair share of the costs of the road network that conventional vehicles are paying via fuel duty. However, the lower operating costs of EVs are a necessary incentive to purchase while capital costs remain higher. As capital costs fall, as is expected, scope would develop to charge users of EVs by introducing a road pricing regime from which conventional vehicles were exempt.

Introduction of general road pricing on top of fuel duty would be invidious for lower income motorists who are likely to continue to use conventional vehicles for longer than the better off. Accordingly, one possibility would be to introduce a general road pricing system but crediting conventional vehicles with the fuel duty they pay. This is the basis of a voluntary pilot scheme in Oregon[3]. Because this scheme is voluntary, uptake is incremental, in contrast to an obligatory scheme that would have to be imposed all at once.

It is worth considering options for incremental roll-out of national road pricing, given the potential difficulties of overnight national implementation of charging and enforcement technologies. In London, the existing congestion charging system functions sufficiently well and is publicly acceptable, but its scope is limited by the fixed charge for entering the charging zone.

There are a number of incremental developments of the London scheme that might be feasible:

  • Encourage participation via a smartphone app by offering a discount from the standard daily charge;
  • Take advantage of location awareness of smartphones to identify when the user is both in a vehicle registered for the charge and in the charging zone, backed up by camera enforcement as at present;
  • Encourage entry and exit from the charging zone outside times of peak congestion by offering a discount from the standard daily charge;
  • Increase the standard charge but offer discounts to encourage use when and where traffic is less congested;
  • Extend the charging to other areas of London where congestion is a problem;
  • Make the charging and enforcement systems available to other cities that wished to manage local traffic, incentivised by the revenues that could be used to provide alternatives modes of travel to the car.

Once a number of cities were using road pricing, there would exist the basis for national adoption in the form of an established charging system, which would need to be supported by the national roll-out of camera enforcement (unless a better enforcement system could be devised). This would be accompanied by the reduction and eventual abolition of road fuel duty, perhaps with the public assurance of no net increase in revenues from road users. There would need to be a daily penalty charge for those evading payment for road use, which, if not paid when requested, might be added to the annual VED charge, failure to pay which could result in clamping.

Whichever way to bring it about, a decision to adopt national road pricing would need to be strategic, commanding wide acquiescence, analogous to the decision to phase out internal combustion engine vehicles.

Conclusion

Adoption of a scheme of national road pricing would allow loss of revenue to the Exchequer from road fuel duty to be offset. A scheme that generated revenues for both central government and local authorities would allow substantial devolution to the latter of responsibilities for funding the provision of their transport services in the light of local needs. A national road pricing scheme might be developed incrementally from the congestion charging arrangements in London.

21 January 2021


[1] Department for Transport, Road Traffic Forecasts 2018, Scenario 7.

[2] Metz, D. Tackling urban traffic congestion: The experience of London, Stockholm and Singapore. Case Studies on Transport Policy, 6(4), 494-498, 2018.

[3] https://www.myorego.org/

Below are the main points and implications of my analysis of the outcome of widening of the M25 motorway between Junctions 23 and 27, published as ‘Economic benefits of road widening’, Transportation Research Part A, 147, 312-319, 2021. Abstract available at https://www.sciencedirect.com/science/article/abs/pii/S0965856421000872 Manuscript available from david.metz@ucl.ac.uk

  • The M25 motorway was widened between Junctions 23 and 27 as part of the Smart Motorway investment programme implemented by Highways England. Detailed traffic monitoring reports were published before the scheme was opened and for three years afterwards.
  • There was some increase in traffic speeds at Year One after opening, compared with Before opening, but this gain was lost subsequently account of increased volumes of traffic. At Year Three, average daily traffic was up by 16% compared with Before, and up 23% at weekends. This contrasts with an increase of 7% for regional motorway traffic growth.  
  • The conclusion of the Year Three monitoring report states: ‘These results show that increases in capacity have been achieved, moving more goods, people and services, while maintaining journey times at pre-scheme levels and slightly improving reliability.’ However, this could not have been the basis of the investment case, which in general suppose that travel time savings are the main benefit of transport infrastructure investment. Accordingly, reports of the traffic and economic modelling were obtained; these utilised the long-established SATURN and TUBA models.
  • The traffic model projected increased traffic volumes and speeds for the scheme opening year, comparing the ‘do something’ investment case with the ‘do minimum’ case without the investment. However, the increase in traffic volume was less than the observed outturn and the increase in speed forecast failed to materialise beyond the first year after opening.
  • The modelled economic benefits derived very largely from time savings for business users. There were also time savings for local users, commuters and others, but these were almost entirely offset by increased vehicle operating costs. This was the consequence of local users rerouting trips between unchanged origins and destinations to take advantage of short journey times made possible by diverting to the motorway, travelling somewhat greater distances.
  • The benefits forecast for business users were the main input to the economic appraisal that generated a benefit-cost ratio of 2.9, which was the basis for the investment decision. However, the time savings benefits did not materialise beyond the first year after opening, on account of the additional traffic above forecast.
  • The nature of this additional traffic cannot be deduced from the traffic monitoring. It is likely that much, possibly most, comprises local trips rerouting, of no net economic benefit; indeed, these trips would be of negative benefit on account of the additional externalities (carbon etc) arising from the increased distance travelled. The outturn BCR must be much less than the forecast 2.9, possibly even negative.
  • This M25 case is likely to be typical in that the Strategic Road Network comes under greatest stress in or near major urban centres where local traffic competes for carriageway with long distance users. Highways England has 10 smart motorway schemes in its current investment programme, with an average BCR estimated as 2.4. This likely reflects considerable optimism bias in the modelling.
  • The modelling to support decision making distinguishes between different classes of road user, yet the traffic monitoring does not allow such a distinction. The monitoring is therefore of limited use in refining the models and countering optimism bias. What is needed is monitoring of representative samples of road users over time to see how their travel behaviour changes as the result of the road investment. Such longitudinal studies, as they are known, are common in the areas of health and social sciences, but almost unknown for travel and transport.

Recent revisions to the road traffic statistics appear to show that there has been a substantial growth of motor vehicle traffic on GB minor roads in recent years, from 108 to 136 billion vehicle miles between 2010 and 2019, an increase of 26%. Traffic on major roads rose from 197 to 221 bvm over the same period, an increase of 12%.  (DfT Road Traffic Statistics TRA0102).

Road traffic statistics are based on a combination of automatic and manual traffic counts. Major roads are well covered in that traffic in all links is counted on typical days, although not every link in every year. Given the vast number of minor roads, however, it is only possible to count traffic at a representative sample of locations every year, and the observed growth is applied to minor road traffic overall. Estimates from a fixed sample may drift over time such that the sample becomes less representative of the changing minor road network. To account for any errors incurred in the fixed sample, the sample is revised through a benchmarking exercise every decade, involving a much larger sample of locations.

The most recent minor roads benchmarking exercise was published in 2020, based on 10,000 representative locations. Overall, the benchmark adjustment for 2010-2019 was 1.19, which is the factor to be applied to 2019 data from the original sample to bring this to the observed traffic level. Data for minor roads traffic for intermediate years are adjusted pro rata, to avoid a step change in the reported traffic data. There is significant regional variation in the adjustment factor, from 1.35 for Yorkshire to 1.09 for East of England, with London at 1.32. For B roads the factor is 1.25, for C roads 1.17; while for urban roads, 1.22, and for rural roads, 1.15. Applying the regional weightings yields an increase in traffic on minor roads of 26%, as noted above, whereas the increase based on the original sample would have been 6%.

The previous benchmarking exercise published in 2009 found a smaller overall adjustment factor of 0.95, with a regional range of 0.81 to 1.08.

The substantially greater adjustment required following the recent benchmarking, compared with the earlier exercise, suggests that there has been a real change in use of minor roads, beyond errors arising from drift in the sample. Importantly, had the increase in minor road use been spread evenly across the national road network, the traffic estimation based on the sample would have been close to that from the benchmark exercise. Hence the major difference between sample and benchmark indicates considerable heterogeneity of minor road traffic growth. Moreover, the fact that the sample failed to detect the traffic growth suggests either that the process for establishing the sample was deficient in some way, or that significant changes occurred in use of minor roads over a decade.

DfT statisticians have created a revised minor roads representative sample (4,400 locations) from the latest benchmark data, which will be used for the coming decade. It would be desirable to have comparative analysis of the previous and the new samples, to gain insight into what has been happening on the minor road network. Regrettably, the statisticians only report findings, and do not attempt to explain them, which leaves uncertainty as to the nature and cause of the reported changes to traffic volumes. The representative nature of the new sample must be questionable if the reasons for the failure of the previous sample to reflect reality are not understood and addressed.

Transport for London has recognised this uncertainty. The recent Travel in London Report 13 discusses the implications of the minor roads traffic correction (p92). The revisions mean that, for 2018, the DfT estimate of vehicle kilometres was 20% higher than previously reported last year (and included in Travel in London Report 12). The previous estimate suggested a fall of 1.8% in vehicle kilometres in London between 2009 and 2018, whereas the revised series now suggests an increase of 17.9% over the same time period, this change wholly arising from revisions to the minor road estimates. TfL notes that it is currently working through how the DfT have made this assessment, and also what this could mean for London data sets. For the moment, TfL is relying on its own traffic monitoring data, although it does not report traffic on minor roads separately.

The National Travel Survey could provide a cross-check on the traffic data. Average distance travelled by car/van driver decreased from 3388 miles per year in 2010 to 3198 miles in 2019, a decline of 5.6% (NTS0303). The GB population grew from 60.95m in 2010 to 64.90m in 2019, an increase of 6.5%. The net increase in car use of about one percent is inconsistent with the new road traffic statistics which show an increase in traffic for all roads of 17% over the same period. The NTS employs a fresh sample of respondents each year, so sample drift should not be a concern. However, it is not clear that the travel diary technique would pick up rerouting to minor roads, given that respondents are asked to provide their own estimates of distance travelled for each trip.

Possible causes of increase in traffic on minor roads

One factor contributing to the growth of traffic on minor roads is the increase in van traffic, including that arising from the growth of online shopping with home deliveries. The number of vans (light commercial vehicles) registered in Britain increased by 28% between 2010 and 2019. Total van traffic increased by 34% over this period, with an increase of 49% on urban minor roads compared with 10% on urban ‘A’ roads, although ‘delivery/collection of goods’ was less important in respect of journey purpose than ‘carrying equipment, tools or materials’. However, in 2019 van traffic amounted to 15% of traffic on urban minor roads, and 19% on rural minor roads, cars being responsible for 82% and 78% of traffic respectively. So, the growth of van traffic on minor roads is responsible for only part of the overall traffic growth on these roads.

Another possible explanation of the apparent large growth of traffic on minor roads is the widespread use of digital navigation (satnav) that offers routes that take account of traffic conditions and estimated journey times. Such devices make possible the general use of minor roads that previously were largely confined to those with local knowledge. This is likely to occur when major roads are congested and represents an effective increase in the capacity of the road network, so generating additional traffic – the converse of the ‘disappearance’ of traffic when carriageway is reduced. Increased use of minor roads is problematic when policy is concerned to decarbonise the transport system and to promote active travel, which these roads facilitate.

The possible role of digital navigation might be investigated by an analysis of the correlation of the upward adjustment factor for each minor road sample location with traffic volumes on nearby major roads – to test the hypothesis that there would be more use of minor roads in areas where major roads were most congested. If so, this factor should be taken into account when setting up the new minor roads sample for the coming decade.

The use of digital navigation has been growing and may continue to grow in the future. A better understanding of the phenomenon would be important for forecasting road traffic growth by means of the National Transport Model and models at regional level and below.

A further possible cause of the changed distribution of traffic on minor roads arises from intentional interventions aimed at reducing such traffic. It has long been the practice to discourage ‘rat running’ on urban minor roads by means of suitable physical control measures, as are used in low-traffic neighbourhoods (LTN). Such measures would reduce traffic in certain locations while possibly increasing it in others through diversion. Some locations in the minor roads sample may be so affected. If LTNs and similar measures increase over time, the sample may become increasingly unrepresentative, a factor that should be taken into account in setting up the new sample. However, the net effect of intentional interventions would be to reduce traffic overall, so this cannot account for the reported growth of traffic on minor roads.

The growth of minor road use by through traffic apparently facilitated by digital navigation would strengthen the case for implementing LTN measures. Alternatively, or additionally, the providers of digital navigation might be encouraged to omit routes that direct through traffic along minor roads.

More generally, the impact of digital navigation on the functioning of the whole road network seems likely to be significant and therefore worthy of investigation.

The above considerations prompt a number of questions:

  1. How reliable are the statistics for motor vehicle use of minor roads, given the apparent sensitivity to the sampling of locations?
  2. How reliable are the NTS findings for car use?
  3. What information is available on the likely causes of the increase of traffic on minor roads?
  4. What is known of the impact of digital navigation on the road network?
  5. What are the implications of digital navigation for transport and traffic modelling?

Summary

The reported increase in motor vehicle traffic on minor roads over the past ten years is substantial and locationally heterogenous, for reasons that are unclear. This lack of understanding raises methodological questions about the sampling of minor roads. The reported increase in traffic is not consistent with the findings of the National Travel Survey, as well as being of concern to Transport for London. While interventions to reduce traffic on urban minor roads may increase the heterogeneity of the sample, they would not increase the volume of traffic. Hence this increase is most likely due to the growing use of digital navigation devices that allow minor roads to be used by those without local knowledge. This has implication for transport modelling as well as for policies to decarbonise the transport system and encourage active travel.

This blog post is the text of an article published in Local Transport Today 19 March 2021