The National Infrastructure Commission has published an interesting discussion paper on capturing the value of urban transport investments. The starting point is the recognition that average travel time changes little, which means that travel time savings do not provide a reliable basis for valuing new investment. The Commission proposes an approach that focuses on valuing agglomeration benefits plus consumer benefits as these increase with increasing population density. Agglomeration benefits have for some time been recognised as appropriate for inclusion in cost-benefit analysis, but a direct estimation of density-dependent consumer benefits is novel.

The NIC paper is welcome fresh thinking, although not without raising issues for consideration. A supporting study commissioned from consultants SDG estimates that the utilisation of available theoretical transport capacity to access city centres ranges from 20% (small cities) to approaching 70% in the 0800-0900 peak hour. There is therefore considerable capacity underutilisation in all cities studied. However, London was not considered. It is possible that capacity utilisation in London is substantially higher, reflecting the pressures of population and economic growth. If so, this would suggest that adding to transport capacity in other cities would not be crucial to stimulate economic growth in the near term. It may not be valid to assume that enough latent demand exists that any additional capacity added will be used.

More generally, while transport capacity can act as a constraint on economic growth, justifying investment in expanding cities, other kinds of investment may be more cost-effective in stimulating lagging cities. This might be investment in broadband, for instance, or in improvements other than infrastructure that falls within the NIC’s remit.

The SDG approach focuses on capacity to access city centres and disregards the potential of faster and reliable travel, as offered by light rail or BRT, that would increase the size of travel to work areas. A study of travel in Birmingham, which has only a single light rail line, prompts the hypothesis that by relying on buses that get caught in congestion at peak times for public transport, Birmingham sacrifices significant size and thus agglomeration benefits, compared with cities of a similar size in France which rely on trams and metros.

Nature of benefits

Estimations of agglomeration and amenity/consumer benefits are based on elasticities derived from econometric studies of correlations between inputs and outputs, controlling for confounding variables. Such benefits are not observed directly and this respect they resemble travel time savings, which are based on the output of models, but not observed in practice. Moreover, the confounding variables are not insignificant, given the typical scatter of data points in plots to quantify agglomeration effects, which suggests that there may be many other possible interventions that might be made, other than those focused on travel.

What is observed as the result of transport investment are changes in land use and market value, the subject of a study for the NIC by the Institute for Fiscal Studies. Increases in real estate values reflect increases in agglomeration and amenity. Arguably, such increases in value would be the basis for a more grounded approach to appraising urban transport investment, more aligned to real world investment decisions.

Although the NIC discussion paper is concerned with urban investments, the approach is applicable to transport investments generally.




Last month, James Dyson announced the abandonment of his electric car project, worth £2bn of planned investment involving 500 staff. One factor in this commercial decision was the difficulty of developing a solid state lithium ion battery, seen as the next step in the evolution of lithium ion batteries. Getting the battery technology right is crucial for achieving commercial advantage in the electric vehicle market. A new entrant needs to offer a significant improvement in performance if it to grow market share, exemplified by Tesla.

Another likely factor prompting the Dyson decision, though not mentioned in press coverage, is the expectation that the car of the future will have autonomous driving options as well as electric propulsion. Autonomy involves either prolonged costly development or buying in someone else’s technology – both involving considerable risk.

As I have argued previously, the benefits to users of the new auto technologies will be incremental, not transformative. Yet the new technologies will be transformative for the manufacturing industry. There is a risk that returns from incremental improvement in performance will be insufficient to reward the large investment in technology development. Dyson may have made a shrewd judgement in cancelling his EV project.

The Financial Times’ Alphaville blog has noted that Uber London Ltd’s accounts filed at Companies House refer to discussions with HM Revenue and Customs about a potential liability for VAT at 20% on either gross bookings or the service fee that Uber charges drivers. This liability may depend on the outcome of a case that Uber is appealing to the Supreme Court to determine whether drivers are self-employed or are ‘workers’ with employment rights. The threshold for VAT liability is £81k a year, so individual drivers are unlikely to be liable. But if Uber is deemed to be an employer, the company would be liable, with potential backdating.

The VAT threshold means that there is not a level playing field for taxi type services. Self-employed drivers, such as the owner-driver of a London black cab, would be at an advantage over a ride-haling company that employed many drivers.

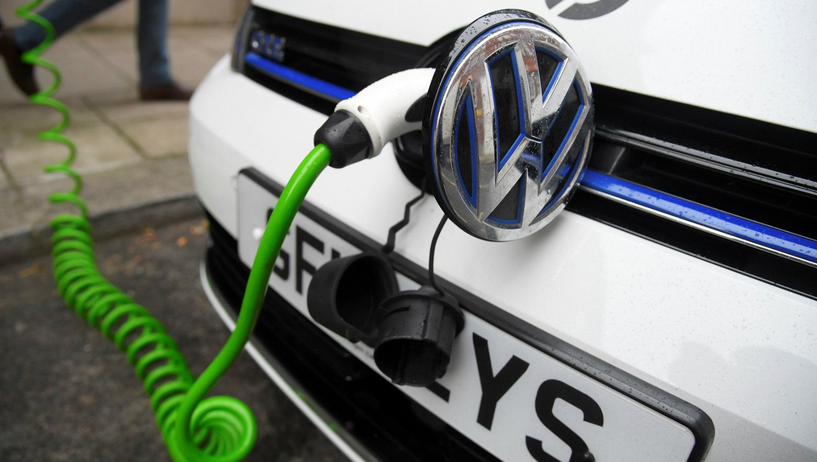
A noteworthy report from bank BNP Paribas, summarised in the Financial Times, compares the energy return on a $100bn outlay on oil and renewables where the energy is being used specifically to power electric vehicles. The  analysis indicates that new wind and solar-energy projects in tandem with battery EVs will produce 6x-7x more useful energy at the wheels than will oil at $60/bbl for gasoline-powered cars and vans, and 3x-4x more than will oil at $60/bbl for those running on diesel. The conclusion is that oil cannot compete with renewables when viewed over the investment cycle unless oil prices are below $20/bbl, which would make oil investment unattractive. This is before taking credit for eliminating tailpipe emissions of carbon and noxious pollutants.

The report’s conclusion is striking – the death toll for petrol. With 36% of demand for crude oil today accounted for by cars/vans and other vehicle categories susceptible to electrification, the oil industry has never before in its history faced the kind of threat that renewable electricity in tandem with EVs poses to its business model: a competing energy source that (i) has a short-run marginal cost of zero, (ii) is much cleaner environmentally, (iii) is much easier to transport, and (iv) could readily replace up to 40% of global oil demand if it had the necessary scale. The conclusion is that the economics of oil for gasoline and diesel vehicles versus wind- and solar-powered EVs are now in relentless and irreversible decline, with far-reaching implications for both policymakers and the oil majors.

In the short run, however, the huge existing investment in oil supply makes this source competitive with renewables/EVs that require substantial infrastructure investment to bring forward new supply.

Smart Motorways, a flagship programme of Highways England, aims to relieve congestion by converting the hard shoulder into a running lane and by varying the speed limit to smooth traffic flow. To assess performance in practice, Highways England has been monitoring closely the section of the M25 between Junctions 23 and 27 since the widened road opened in 2014. Three annual reports have been published, detailing traffic flows, journey times and safety, and comparing outcomes ‘before’ construction and ‘after’ scheme opening. Traffic growth of 16% was observed at Year 3 compared with before opening, far higher than regional motorway growth over the same period, with increases in weekend traffic of up to 23%.

Such traffic growth seems a noteworthy example of induced traffic, the traffic that arises as a result of increased capacity and which tends to restore congestion to what it had been previously. I therefore made a Freedom of Information request to see the traffic forecasts and economic appraisal that were the basis of the investment decision.

The traffic forecasting report was based on a variable-demand multi-modal model for the M25 area, employing the SATURN suite of programmes, updated to take account of the most recent national datasets for trip ends and similar. Traffic forecasts were made for the assumed 2015 scheme opening year, the 2030 design year and the 2040 horizon year, for the morning and evening peak flows and the interpeak period, comparing the ‘do-minimum’ case, without the investment, and the ‘do-something’ case with it.

The time slices used for the forecast and the outturn monitoring are regrettably different, which limits comparisons at particular times of day. Comparisons may, however, be made of average daily traffic flows (ADT). For the section J23-24 clockwise, for instance, the forecast ADT increase, comparing the scheme with do minimum, was 13% in 2015 and 16% in 2030. The outturn monitoring found an increase of 13% at Year 3 after opening compared with before, in good agreement with forecast.

The economic appraisal report employs the DfT’s TUBA software to derive estimates of monetarised travel time savings and vehicle operating costs (VOC) from the traffic forecasts, comparing do-something and do-minimum cases. The main economic benefit is travel time savings to business users, worth £475m, because the scheme was expected to allow travel at higher average speeds than the do-minimum case. Time savings to non-business travellers (commuters and others) were very largely offset by increased VOC, given the assumed diversion from local roads onto the motorway generating longer trips. As an example of the origin of the time savings, the speed on J23-24 clockwise for the AM peak in 2015 was forecast to be 86 km/hr with the scheme, versus 76 km/hr without. The overall benefit to cost ratio (BCR) was 2.3, later adjusted upwards to 2.9.

However, this forecast increase in speed failed to materialise. There has been effectively no change on average for all days and time slices between before opening and Year 3 for the clockwise travel. For anticlockwise, an average saving of 15 seconds (1.4 per cent) was found for a journey of 16.6 min before the improvement. Time savings of 6% and 9% respectively were seen at Year 1 after opening, but were lost by Year 2.

Generally, traffic flowed at the free flow rate except during the PM peak when it was slower. Surprisingly, the extra lane did not permit a faster flow at this PM peak, even though the increase in capacity of 33% was greater than the increase in traffic volume. Possibly the use of variable speed limits to smooth the flow was at the cost of journey time savings.

The stated conclusion of the Year 3 monitoring report is that ‘increases in capacity have been achieved, moving more goods, people and services, while maintaining journey time at pre-scheme levels and slightly improving reliability.’ Yet this conclusion undermines the economic case for the scheme, based on forecast time savings. This in turn raises questions about both the validity of the modelling and of the orthodox approach to appraisal.

We know from the National Travel Survey that average travel time has remained essentially unchanged for at least the past 45 years. This implies that any travel time savings must be short run. In the long run, people take advantage of transport investments that permit faster travel to gain access to more distant destinations, services, opportunities and choices, within the limited time they allow themselves for travel. This change in travel patterns would first be seen in optional trips, consistent with the big increase in weekend traffic in the M25 example, and subsequently over the years as people move home and change jobs. The consequential additional traffic – induced traffic – adds to congestion and negates the time savings that are conventionally supposed to be the main economic benefit.

If we are to make transport investments that are good value for money, we need to pay attention to the real-world consequences, and not be misled by the outputs of models that generate the notional time savings to which transport economists are so attached. We need to constrain models to hold average travel time constant in the long run, consistent with the findings of the National Travel Survey. To calibrate models, we need data on origins, destinations and purposes of trips, and how these change when a road is widened. And we need to work out how to value access benefits to users.


This blog is based on an article published in Local Transport Today 24 May 2019


I blogged some months back about a paper of mine published in a peer-reviewed journal. This was a critique of the orthodox approach to the cost-benefit analysis of transport investments, which focuses on the saving of travel time. My paper has prompted three senior transport economists to publish a response in the same journal. They say: ‘Metz makes some good points, but many of his key arguments are unsound.’ Naturally, I disagree with the latter proposition.

The three economists concede that the conventional approach to appraisal is weak on the spatial distribution of the benefits of investment, which is important to decision-makers. An example here is High Speed 2, the planned new rail route connecting London to the cities of the Midlands and the North. The strategic case for this very large investment is to boost the economies of these cities by improving their connectivity to the dynamic economy of the capital. However, the conventional economic case sees the benefit as largely time saving for business travellers, and is silent on its spatial distribution. What we need is economic analysis that quantifies the strategic case. This is lacking.

More generally, the purpose of the transport system is to move people and goods through space. Investment increases such movement, whether by increasing the speed of travel so that people go further in the time they allow themselves for travel, or by increasing capacity at existing speeds, so that more people are able to travel. In either case, an important consequence is change in land use and land value, reflecting the increased access made possible by the investment. Transport planners well understand how transport investment increases access and changes how land is used, whereas transport economists are fixated on notional time savings – notional because they are the output of models, not observed in practice. What we observe in the findings of the National Travel Survey is that average travel time has hardly changed over 45 years, despite many £ billions of transport investment justified by the value of supposed time savings.

I have a new article that reviews the evidence for the success of congestion charging (aka road pricing, road user charging) in the three major cities in which it has been tried. In London, there was a marked reduction in both car traffic and delays when charging was introduced, but delays reverted to previous levels by year five. In Stockholm, a similar initial impact was seen, but there was no monitoring of delays subsequently.

Singapore has been successful in using electronic road pricing to maintain desired traffic speeds, adjusting charges up or down according to whether speeds have exceeded or fallen below targets. However, this is only possible because there is a very high charge for vehicle ownership, which has limited this to 100 cars per 1000 population, compared with 450 in the UK and similar or higher figures for other developed economies.

Road traffic congestion occurs in areas of high population density and high car ownership. There are more trips that could be made by car than are in fact made. Some people are deterred by the prospect of time delays and make other choices: a different time or mode of travel, or a different destination, or not to travel at all. Measures that deter some drivers, such as congestion charging, reduce delays when introduced, which makes car travel more attractive to those who are more time-sensitive but less cost-sensitive, so that traffic increases and delays revert to previous levels. Accordingly, congestion is both self-regulating and difficult to reduce.

Although economists believe that road pricing is the proper way to tackle congestion, in practice the level of charges to make a useful impact would probably be too high to be publicly acceptable.

The National Infrastructure Commission has been consulting on a number of questions, including how  the Government could best replace fuel duty in a way that is fair.

 The prospect of a complete switch to electric propulsion for cars and vans will lead to loss of most revenue from fuel duty, currently about £28 billion a year (HGVs might still require taxable fuel), offset to a small degree by VAT of 5 per cent on electricity. Vehicle Excise Duty raises some £6 billion a year, rather less than the annual capital and current expenditure on national and local roads of £8 billion in total. So VED could be raised to cover the full cost of the road system. But that would leave a major gap in public revenues and would, in the long run, imply much cheaper motoring – welcome to motorists but problematic in respect of the detrimental impacts of the car.

To fill the revenue gap it would be logical to levy a charge on the use of electric vehicles (EVs). This would be a charge related to distance, weight of vehicle (which determines damage to carriageway), location and (possibly) time of day (reflecting congestion which imposes costs on other road users). It would also be possible to relate charges to the cost of the vehicle when new, so that the better off road users paid more than those who could only afford a reasonably priced family car.

The public rationale for such a charge would be that it is right that EVs should contribute their fair share of the revenues raised from road users, both to cover the costs of operating, maintaining and developing the road network, and to meet the wider needs of society.

EVs could only be charged for road use once their costs permitted this. At present, the lower cost of electricity goes part way to offsetting the higher capital cost of EVs. However, capital costs are expected to fall as battery technology advances, so that over time cost headroom will develop that will allow EVs to be charged for road use while maintaining their economic attractiveness in relation to conventional vehicles.

Devolution

Road user charging would allow devolution of revenue raising to fund the road system. One tranche of revenue would be taken by the Treasury to support general government expenditure. The remainder would be retained by road authorities to fund their expenditure on roads and other transport provision. The Department for Transport would decide charges for the Strategic Road Network, while local authorities with responsibility for roads would set charges for their networks. There would need to be some coordination of approach to minimise diversion of traffic onto unsuitable roads, perhaps a responsibility for the Office of Rail and Road.

Road authorities would set charges according to their revenue and investment needs: problems with potholes would justify raising charges, as would plans for additional capacity. The income stream from charges could be used to raise finance for capital projects. Devolution of revenue raising to road authorities would largely obviate the need for grants from central government, other than perhaps for regional ‘rebalancing’. If, like London, local authorities chose to manage demand by means of a congestion charge, the revenue could be used to fund public transport. This would provide an important tool to influence the pattern of urban transport.

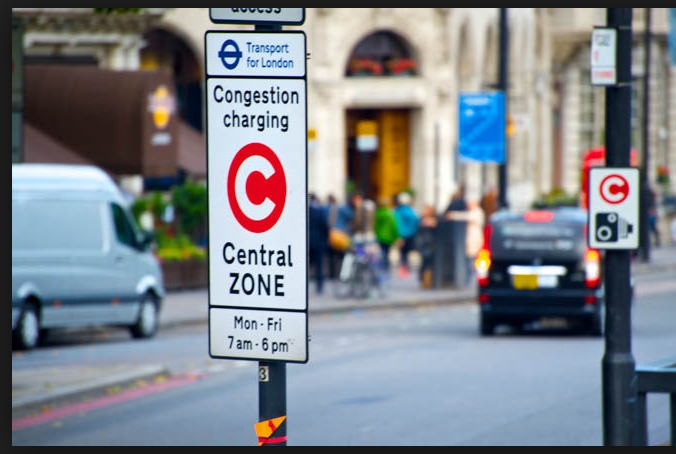
The London congestion charge is well accepted by the public, is technically reliable and raises useful revenue. It is, however, based on a daily charge for entering the charging zone within the charging hours, regardless of level of traffic or distance travelled. The Mayor’s draft Transport Strategy indicates that consideration will be given to the next generation of road user charging systems, to help achieve policies for mode share, road danger reduction, environmental objectives, congestion reduction and efficient traffic movement. It would be sensible for consideration of technology options to be a joint effort between TfL and DfT, so that London could act as a test-bed for arrangements that are capable for national use in due course.

The technology for road user charging would comprise a digital platform with a vehicle-based device displaying an app. Other facilities could be offered on the device including route guidance to avoid congestion, journey time information, indication of available parking, facilities for sharing trips with those travelling in the same direction, and information about non-car modes of travel where these are practicable alternatives. The menu of options would trade off speed, quality and cost. This technology would allow the operation of the road network to be optimised, reliability to road users to be improved, and the costs of maintenance, operation and development to be recovered through charges that reflect costs.

Uber’s buccaneering entry into regulated taxi markets in many cities prompts questions about the purpose of regulation and who benefits. While there is little academic literature on the topic, a 2016 paper* by Harding, Kandlikar and Gulati, focused on North American taxi markets, is illuminating. It is argued that the case for regulation is based on the view that the taxi market suffers from three problems: ‘credence good’, open access and thin market:

  • A credence good is a good or service whose quality cannot be determined by the consumer until after it has been consumed. Questions about reliability of a taxi service may deter users who may be concerned about excess charges or a poor quality vehicle. Regulation that sets standards for quality and price overcomes such market failure.
  • Open access to the market may attract large numbers of new entrants on account of low costs of entry. Given limited demand in the locality, earnings of drivers would fall, increasing the incentive to illegitimate charging and poor vehicle maintenance.
  • A thin market has a small number of buyers and sellers, which reduces the chances of matching supply and demand. The taxi market is thin in that it is geographically dispersed. Regulation of fares prevents exploitation of users when demand exceeds supply.

The entry of Uber and similar ride hailing platforms impacts the taxi market in a number of ways:

  • Barriers to entry for drivers are lowered, and users are attracted, shifting a thin market to a thick one.
  • Fares flex according to demand but are specified before the trip is undertaken. Surge pricing attracts drivers to meet peaks of demand.
  • Quality rating of both drivers and passengers, plus predictable fares, helps ensure consistent standards of service.

Thus the platforms address the shortcomings of traditional taxi markets that have justified regulation, effectively removing two of the rationales for taxi regulation, and largely mitigating the third (open access), Nevertheless, the implications of competition between platforms are as yet unclear. Competition could lead to instability on both supply and demand sides, which could result in collusion by platforms, to the disadvantage of drivers and passengers; while lack of competition may result in monopolistic pricing.

The paper concludes that regulators should allow the ride hailing market to grow and focus on the possibilities of future monopoly and of collusion between platforms.

*Taxi apps, regulation, and the market for taxi journeys. Transportation Research Part A: Policy and Practice, 88, 15-25, 2016.


I blogged recently about the economics of Uber and other ride hailing services. Further light has been shed by the excellent new book from Andrew McAfee and Erik Brynjolfsson of the Massachusetts Institute of Technology: Machine, Platform, Crowd. From this I gleaned the thoughts below.

Network effects have long been recognised: some services become more valuable to each user as more people use them. The telephone is the historic example, WhatsApp a recent instance. Network effects reflect demand-side economies of scale, where benefits to users, the source of demand, grow as the scale increases (contrasted with supply-side economies of scale where costs fall as scale increases).

Two-sided digital platforms serve to match supply with demand. The most successful take advantage of network effects to become powerful aggregators of both supply and demand. They are early to the business space and pay a great deal of attention to user interfaces and experience, since users may be unwilling to employ more than one or two competing platforms.

In the transport sector, we are concerned with platforms that function ‘online to offline’ – digital access to physical mobility. Examples: Uber, Lyft, Gett and other taxi services, BlaBlaCar and Liftshare for ride sharing, car clubs, dockless bike hire by app, online rail ticketing. As well as matching users with services, the platforms optimise operations, for instance selecting the fastest routes and predicting the location of future demand. The negligible cost of digital scaling means that these platforms can handle huge volumes of information – about user preferences, availability and price of services, payments etc.

In the past such data handling would have been limited to large organisations. Now, the availability of cloud computing with unlimited amounts of capacity helps innovators enter the market, scale rapidly and compete aggressively.

Demand side economies of scale can grow much faster than costs. However, the main challenge for digital platforms arises because the supply side involves physical plant and infrastructure whose capacity is finite, hence capacity, a perishable commodity, must be carefully managed. An important tool is revenue management, pioneered by the budget airlines, where varying price is used to match supply with demand – which needs lots of data and lots of supply and demand to run well.

As well as benefiting from network effects, digital platforms can reduce information asymmetries that inhibit transactions, such as whether you can trust your taxi driver, particularly in an unfamiliar city. Uber asks both customers and drivers to rate each other after each transaction, which allows poor performers to be dropped and increases confidence in quality of service.

Operators of two-sided platforms typically prefer lower prices than their providers of service. The maximum revenue of a taxi service arises at low fares, given the price elasticity of demand. However, two-sided platforms have to satisfy both providers and users. Lower fares increase demand, which will attract more providers onto the system, a benefit to providers. But lower fares also mean less income to drivers.

There is a belief that two-sided platforms for taxis offer network demand side economies of scale such that the biggest platform will dominate each local market. Patient capital to support growth of the market will reduce the marginal costs of arranging a ride, to yield attractive returns to investors.

Assessment

Analysis of the economics of transport digital platforms is at an early stage.  A key question is whether scale economies would tend to result in monopoly, or whether competition would arise on account of low barriers to entry and a gig workforce open to recruitment by the offer of better terms.


Check refs