I made a presentation to the Highways UK Conference held at Birmingham 2-3 November 2022. These are the main points.
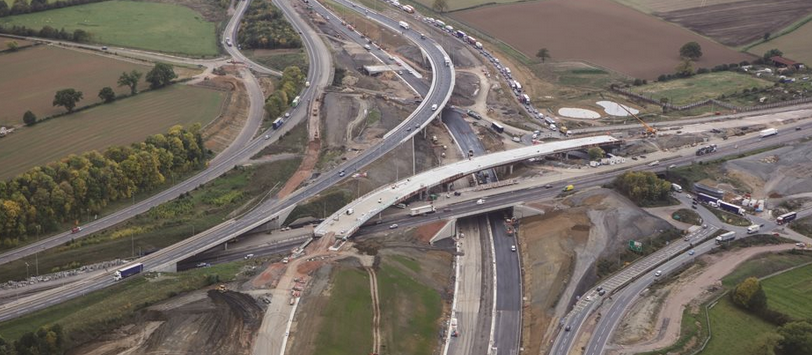
The widespread use of Digital Navigation (DN) (generally known as satnav) is changing travel behaviour (see my recent paper). One impact is to divert local users to major roads to take advantage of increased capacity. I have analysed two Smart Motorway investments in detail: M25 Junctions 23-27 and M1 Junctions 10-13. The Smart Motorway concept involves converting the hard shoulder to a running lane, originally during the periods of morning and evening peak demand, or, as has been recent practice, throughout the day. The advantage is that capacity can be increased without the cost of additional land take or rebuilding bridges.
Monitoring the traffic flows and speeds 3-5 years after opening of the two schemes showed that the forecast increases in speed had not occurred, and hence the economic benefits, which largely depend on the value of time savings, were not obtained. Something had gone badly wrong with the traffic modelling that informed the investment decisions. Accordingly, I sought and obtained copies of the relevant reports.
The traffic modelling in both cases employed regional variable demand models that utilised the long established SATURN software. Traffic flows and speeds for the with- and without-investment cases were compared, and the outputs fed into the economic model, the Department for Transport’s TUBA model, which forecasts the economic benefits. In both cases, substantial travel time saving benefits were projected for business users, offset by a small increase in vehicle operating costs (VOC). There were also substantial time savings for non-business users (commuters and others) but these were very largely or entirely offset by increased VOC. Hence there was no net economic benefit to non-business users. It seems likely that increased number such users, above that forecast, pre-empted the increased capacity intended for longer-distance business users.
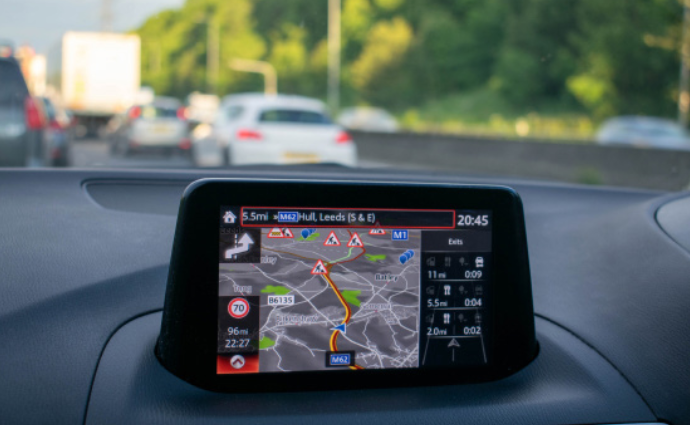
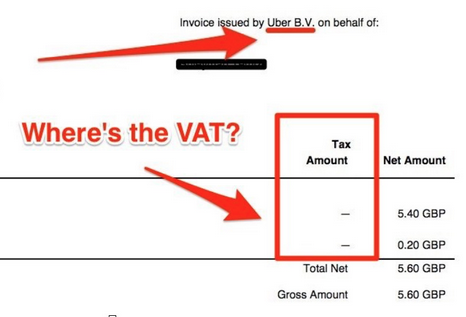
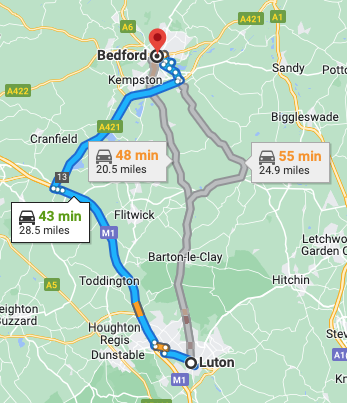
Examination of the routing information offered by Google Maps, for a journey between two locations in the neighbourhood of a Smart Motorway scheme, shows that diversion to the motorway can save time, but at the cost of increased distance and hence fuel cost (see screenshot at top). This is consistent with the modelling, on the basis that road users are likely to take the faster route and be less concerned about VOC.
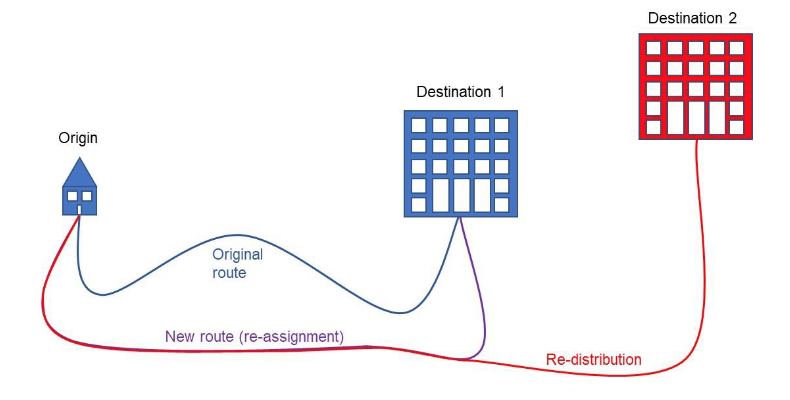
Those making local trips have a variety of options, using the motorway as well as local roads, while long-distance users are likely to stay on the motorway. In the past, local users would have made routing decisions based on recent experience of congestion and broadcast traffic information. But with the widespread use of DN, the choice of the fastest route is clear. The impact of DN is to increase local use of motorway capacity, to the disadvantage of longer-distance users. This seems likely to be an important contributory factor to the failure of the M25 and M1 Smart Motorway investments to deliver the expected travel time savings.
Although detailed information is available only for two Smart Motorway schemes thus far, it is likely that these may not be unrepresentative. The Strategic Road Network (SRN) is under greatest stress in or near areas of population density, where local users and longer-distance users compete for road space. Remote from such areas, the traffic generally flows fairly freely. So opportunities for investment appear to be where local users are best placed to take advantage of new capacity.
If the motorway system operated as a toll road, as in France or Italy, tolls would deter use by locals. The one example in the UK is the M6 Toll road in the West Midlands, built and operated with private finance, where daily traffic is half that on the adjacent M6 proper, doubtless due in part to the toll that local users do not choose to pay. But this is the exception that proves the rule: which is that attempts to alleviate congestion by increasing the capacity of major roads experiencing marked peaks of traffic at commuting times, as with Smart Motorways, must be expected to result in increased use for local trips, to the disadvantage of longer-distance users.
To better appreciate the benefits of road investment, it would be important to understand the impact of DN on road user behaviour, so that this can be incorporated into the traffic modelling that informs investment decisions. It would also be important to get a more granular evaluation of outcomes of investment. Traffic and economic modelling of prospective investments distinguishes between business and non-business users, the former split between cars, light goods and heavy goods vehicles, and the latter between commuter and other journey purposes. In contrast, monitoring of outcomes only tracks total traffic, volume and speed. However, it is now possible to employ DN to distinguish between local and longest-distance traffic, as exemplified by the TomTom Origin/Destination analytical service. Making such a distinction is important for evaluating the economic benefits of investment since the total volume of traffic might be close to that forecast, but if the share of local users is greater than forecast, the economic benefit will be less than expected.
We are at present midway through the second five-year road investment programme, known as RIS2, worth £27bn over the period 2020-2025. RIS3 is now being planned. But there are headwinds:
- The potential economic benefits are likely to be overstated, as discussed above.
- Any increase in road capacity is inconsistent with the Net Zero climate change objective since both tailpipe and embedded carbon would be increased.
- There are public anxieties about the safety of Smart Motorways in the absence of the hard shoulder, reflected in a critical report from the House of Commons Transport Committee, to which the government responded by halting new schemes until five years of safety data is available.
- The government’s Levelling Up White Paper, published in early 2022, identified a dozen ‘missions’ across departments. The single mission for the Department for Transport is aimed at improving public transport in regional cities towards that achieved in London, a sensible political and social objective. There was no reference to road investment, which is sensible given that congestion delays on the SRN are less in the Midlands and North than in the South East.
- Current pressures on medium term public expenditure.
Given these impediments, there is a good case for treating the SRN as a mature network, with a focus on operational efficiency. This is the case for urban roads, which in the past were enlarged to accommodate more traffic, but nowadays the trend is to reduce capacity allocated to general traffic, to encourage active travel and facilitate public transport. Similarly, the aviation sector focuses on operational efficiency – airlines maximising use of aircraft, allocated routes and passenger load factors; airports (struggling recently) optimising throughput of passengers and baggage; and air traffic managment making best use of crowded airspace. The underlying discipline is operations research, not civil engineering, plus the modelling and economic analysis of operations, not long-lived investment.
A focus on operational efficiency of the SRN would naturally prompt consideration of how best to take advantage of the huge investment in DN that has been made, both by providers of the service and by road users. Here a very odd phenomenon is the apparent disregard of DN by road authorities, at least a judged by their publications – no reference to satnav in those of National highways, the Department for Transport, or local authorities (with the one exception known to me, Transport for London’s collaboration with Waze). Why is this? Possibly because of the preoccupation of highways engineers with civil engineering works, the need to spend the large budget allocated to the SRN, the lack of professional background to cope with digital technologies, and that fact that road authorities are monopolies, so not subject to competitive pressures?
The one constituent of road users that is highly competitive is road freight, particularly that forming part of integrated logistics businesses, which makes extensive use of digital technologies to manage fleets on the SRN and delivery vehicles on local roads. We are well aware of this when we order goods online, with a specified delivery date and often a time slot, the ability to track packages, delivery confirmed on the doorstep, and our feedback sought on the experience – all done by algorithm. This kind of operational efficiency needs to be brought to bear on the totality of traffic on the road network.
Experienced network operators would naturally want to take advantage of DN, which is vehicle-to-infrastructure connectivity that is changing travel behaviour on a massive scale. One aim would be better to cope at times of stress – major incidents, bad weather, peak holiday flows. A second would be to optimise use of the network in normal times, including avoiding routing traffic through unsuitable minor roads.
There is a maxim that you can’t build your way out of congestion, which we know from experience to be generally true. The Smart Motorway case studies exemplify this truth and provide an explanation: increased capacity is taken up by local users, pre-empting capacity intended for longer-distance business users, with no overall economic benefit, and restoring congestion to what it had been before. However, when road users are asked why congestion is a problem, their main concern is the uncertainty of journey time. Digital Navigation provides estimates of journey time in advance, so those who need to be at their destination at a particular time can decide when best to set out; those who are more flexible can avoid the worst of congestion; and all can choose the fastest route.
Digital Navigation is vastly more cost-effective as a means to mitigate the impact of road traffic congestion than costly civil engineering investment.