The Department for Transport has recently issued a new set of National Road Traffic Projections (known as ‘forecasts’ in the past, ‘projections’ perhaps indicating rather less commitment to the findings). These apply to England and Wales and look ahead as far as 2060. The new projections are derived from the DfT’s National Transport Model (NTM), which has been developed and updated since the 2018 forecasts – so it is claimed, but see below.
The projections relate to a set of Common Analytical Scenarios, developed by DfT with the aims of better assessing uncertainty in scheme appraisal. There is a Core Scenario plus seven variants illustrating differences in economic growth, regional distribution of population, behavioural change, new technology and decarbonisation. Except for the Behavioural Change scenario, the other variants were created by changing some of the Core Scenario assumptions. For the Core Scenario, relationships between the key drivers of demand and road traffic are broadly assumed to continue in line with historical trends.
A noteworthy feature of the new projections is that traffic is expected to grow in all scenarios, by between 8% and 54% to 2060. This contrasts with the widely held view that car use needs to be reduced to meet the Government’s commitment to Net Zero by 2050, although this is not the DfT’s view. Projections of CO2 reductions to 2060 range from 38% to 98%, depending on scenario.
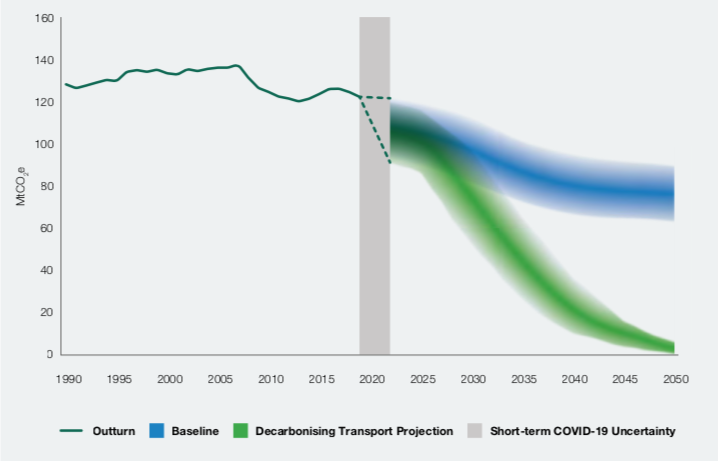
The Core Scenario is based on ‘existing firm and funded policies only’ and projects a 22% increase in traffic to 2060 and a 42% decrease in carbon emissions. Yet Net Zero by 2050 is surely a firm government commitment. The DfT published its Transport Decarbonisation Plan in 2021 which projected that this would be achievable, implying that future funding and policy development would need to constrain carbon emissions from road traffic to that indicated by the low carbon scenario projections. In which case, one might wonder why publish high carbon projections that go less than half way to achieving Net Zero.
This notion of ‘existing firm and funded policies only’ is stated as encompassing published plans or funded policies. So perhaps the civil servants are drawing attention to the shortcomings of the Transport Decarbonisation Plan, which was pretty vague about the details, particularly about the achievement of behavioural change. Carbon emissions under the Core Scenario are projected to fall initially quite rapidly, but then level off, apparently because ‘the details of future car and LGV regulations to reduce CO2e emissions beyond this point have yet to be finalised.’ (para 4.15 of the NRTP). Certainly, the details of the ‘ZEV Mandate’ remain to be settled – this is intended to oblige manufacturers to sell a specified increasing proportion of zero emission vehicles during the transition – a relevant factor may be the availability of battery production in the UK, which may require government financial support. Perhaps ministers are having a wobble about this Mandate, leading the civil servants to point up the implications for Net Zero of a weakening of policy intent. Nevertheless, it all seems very odd. If no new cars and vans propelled solely internal combustion engines are to be sold after 2030 (hybrids after 2035), then the normal turnover of vehicles would mean continuing decarbonisation until all internal combustion engine vehicles are scrapped (the average age of car at scrappage is around 14 years).
Congestion delays are projected to increase by between 4% and 59% by 2060, depending on scenario, which would provide a justification for creating more capacity. So another possible explanation of the ‘firm and funded’ qualifier is that no account has been taken of a future road investment programme, in particular RIS3 for the period 2025-2030, currently being planned.
In contrast to the Core Scenario, there are three scenarios that project carbon emissions reducing to near zero by 2050. The Vehicle-led and Mode-balanced Decarbonisation Scenarios assume high and fast uptake of EVs and other zero emission vehicles ‘in line with the government’s stated ambitions to end the sale of diesel and petrol cars, vans, HGVs,
and buses/coaches.’ (para 4.48). The Technology Scenario adds a high uptake of connected and autonomous vehicles.
A further scenario of interest is a Behavioural Change Scenario, involving new ways of working, shopping and travelling. This reflects past falling trends in driving licence holding by young people and in trip rates for most purposes, as well as coronavirus pandemic-induced changes in behaviour that are assumed to continue. Some of the latter assumptions are quite striking: 40% reduction in education trips by 2041, 39% in commuting, 41% in personal business, and 55% reduction in visiting friends and relatives (para 3.37). While it is welcome that the DfT is addressing the scope for changes in travel behaviour, these particular assumptions seem on the high side. Nevertheless, the impact of these behaviour changes is surprisingly small – only to level off the growth of car traffic, with van traffic increasing by 45% to 2060 (para 4.39), to compensate for car trips not taken. Car carbon emissions are similar to those of the Core Scenario, indicating that behavioural change in itself is expected to make minimal impact.
The new traffic projections adhere to the traditional practice of predicting demand for road travel driven predominantly by changes in travel costs, population and economic growth, 90% of demand growth being attributed to these factors. A large number of other factors are considered, which is appropriate since they are relevant. The outcome is an extremely detailed formulation of a set of scenarios, which therefore avoids criticism that potentially important factors have been disregarded, but it is then hard to see the wood for the trees.
Big picture
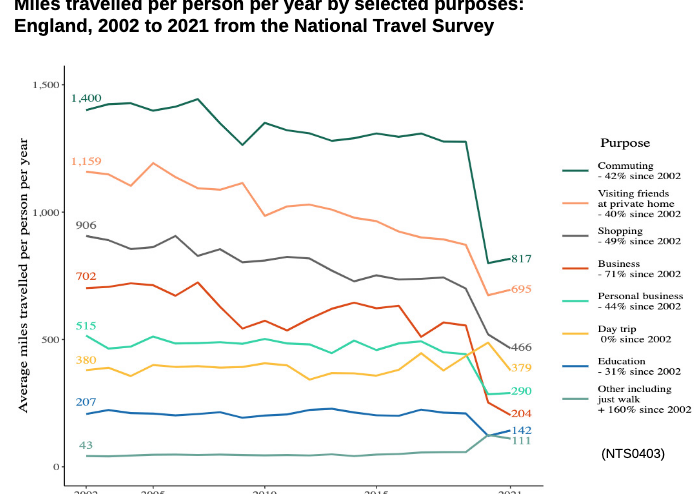
So, let’s stand back from the detail, to see the big picture, which in my view is this: the National Travel Survey has found a gradual decline in per capita travel since the turn of the century, including decline in the average number of trips taken and in distance travelled by car (prior to the pandemic) (see Chart above). This followed rapid growth in car use in the last century, mainly the result of increasing car ownership. But household car ownership has stabilised, with some three-quarters of households owning one or more cars or vans. There was a clear break in trend at the turn of the century, which implies a change in relationships between the determinants of demand and growth of car use. Accordingly, for modelling purposes, such relationships (known as elasticities) need to be forward-looking; assuming continuity of historic trends, as does the Core Scenario, is inappropriate.
The average distance travelled per capita by car depends mainly on three factors: speed of travel, time available for travel, and level of car ownership. The first two seem unlikely to change in the future, and while there has been growth of the number of cars owned within car-owning households, the second or third car tends to be used less than the first. The impact of economic growth and income growth on per capita car use is a second order effect, seen mainly as the purchase of larger, more expensive and fuel-consuming vehicles, notably SUVs. The unvarying travel time constraint, of about an hour a day on average, limits the distance that can be travelled, irrespective of income. The DfT Projections assume that three-quarters of the projected traffic growth is driven by increases in GDP and reduced costs of driving (para 4.7), which seems improbable.
That leaves population growth, which the new traffic projections take from the Office of Budget Responsibility as an overall 4% increase by 2060, and which therefore would have a very small impact on travel demand. The consequences for road traffic growth would depend on the extent to which the additional inhabitants were accommodated in new homes on greenfield sites where car use would be the norm; or at higher density within existing urban areas, where public transport would be relevant. Unfortunately if understandably, the Regional Scenario considers accommodating the population growth in regions beyond the Wider South East, which may be relevant to the Levelling Up agenda but has little impact on overall traffic or carbon emissions.
So, I would not expect much future change in either per capita car use or total road traffic, based on recent trends. This conclusion is at odds with the DfT modelling and so raises questions about the validity of the NTM, which has been in use for over twenty years in a series of versions. The version cited in the new projections is NTM version 2 Rebased (NTMv2R), which is unexpected since a new version, NTMv5, was announced in 2019.
Modelling regressed
NTMv5 was developed as a spatially detailed model to complement NTMv2R by providing additional capabilities for assessing the impact of major new road schemes, packages of transport improvements or spatially based charging arrangements. One particular purpose was to develop scenario-based traffic forecasts arising from changes in population, travel trends, GDP, car ownership, fuel price and road tax. Accordingly, it is surprising that NTMv5 does not appear to have been used to generate the new traffic projections.
One possible explanation is that a peer review of NTMv5 by experienced practitioners made a considerable number of criticisms. The reviewers advised caution in application of the model, primarily due to the focus of the NTMv5 being on the more strategic highway network, whereas many of the potential applications relate to urban travel policy and public transport interventions. In particular, the reviewers were critical of the treatment of urban traffic, observing that the assumed relation between traffic speed and demand growth lacked validity, and that the range of policies aimed at reducing urban car use were not taken into account. Besides, it was noted that the DfT’s car ownership model has not recognised that ownership in dense urban areas has been declining for many years in response to increasing population density, notwithstanding rising incomes. The reviewers concluded that the model could not be safely used to examine policies that relate specifically to London, and queried whether this might apply more generally to rapidly growing dense urban areas across England. They took the view that the model should be suitable for use in forecasting the growth of road traffic in most areas other than those adjacent to or within major urban areas, which is a pretty major qualification.
So perhaps the DfT was unable to rectify NTMv5 to respond to these criticisms, and hence reverted to NTMv2R, which had previously been used to prepare the 2018 National Road Traffic Forecasts. This version was also the subject of peer review, the reviewers noting problems with modelling traffic in London and other conurbations where non-car modes are most competitive. The 2018 Forecasts predicted substantial traffic growth in London, but admitted that this was likely to be over-forecasting because travel behaviour in London and relationships between key variables and road traffic demand can be different to the rest of the country, due to a high use of public transport and significantly higher congestion on roads. This was recognised as known issue with the NTM, which it was intended would be addressed in the future (para 4.33 of 2018 forecasts). However, it is not clear whether this has been done, prior to preparation of the new projections.
There is bound to be feedback from congested road capacity to travel demand. In the ‘vision and validate’ approach, nowadays effectively adopted by cities, the vision of the balance between the twin functions of roads – movement and place – means that travel demand must be managed. This contrasts with the earlier ‘predict and provide’ perspective, where forecasts of traffic growth led to proposals to increase road capacity. If our vision now includes Net Zero, the presumption of increased road capacity is problematic, and the modelling should take account of capacity constraints on demand for road travel. Given that over 80% of the UK population live in urban areas, models need to be responsive to urban traffic conditions.
The validity of the NTM is therefore questionable. The modelling suite used to prepare the present projections is complex and opaque, hence it is not possible for those other than DfT modellers and their consultants to understand what has been achieved and what has not. The peer reviews provide an exceptional opportunity to look under the bonnet, and what was found make one doubt whether the NTM in its various versions is reliably roadworthy. And that’s before the problems associated with specifying scenarios to reflect policy uncertainties.
One intention in creating NTMv5 was to make this important model transparent to external stakeholders, which NTMv2R is not. Lack of transparency and accessibility contrasts unfavourably with the online Carbon Calculator of the Department for Business, Energy and Industrial Strategy, open to all.
Projecting future road traffic volumes is not an end in itself, rather it serves policy purposes. Projections of growth of both traffic and congestion delays would help justify a further major road investment programme. Projecting carbon reductions of 98% meets the Net Zero objective. Arguably, the modellers have struggled to reconcile both policy requirements, but have fallen short.
This blog was the basis for an article in Local Transport Today 24 January 2023.