The House of Commons Transport Committee is holding an inquiry into major transport infrastructure projects. Written evidence has been published. My evidence is set out below.

This submission is concerned with the effectiveness of the Government’s decision-making and appraisal processes for transport infrastructure projects, a subject on which I have researched and published in peer-reviewed journals.

Main points

  • The standard approach to the economic appraisal of transport investments, based largely on the value of time savings, does not reflect reality. An independent review of the methodology would be desirable. 
  • The value of transport investment lies in better access to people and places, making possible more opportunities and choices. Improved access changes the built environment, the consequences of which can be valued.
  • Digital navigation (satnav) is affecting traffic flows, and thus the outcomes of road investment, in ways that are little understood. A study is needed.

Time is not saved

The Department for Transport (DfT) has a well-developed methodology for the appraisal of transport infrastructure investments, set out in considerable detail in its Transport Analysis Guidance (TAG, formerly WebTAG, reflecting the pioneering effort to make the material available via the internet). The Guidance is consistent with the Treasury’s Green Book, and indeed appears to be regarded as an exemplar of good practice in economic appraisal in the public sector. However, the Green Book does not deal with the specifics of transport investment, so that the recent changes to it, while welcome, do not bear on what follows.

The main economic benefit supposed to arise from investment in transport infrastructure is the saving of travel time. Accordingly, the DfT has commissioned considerable analysis designed to attribute values of time to different classes of user of the transport system, according to mode and purpose of travel. Travel time savings typically amount to 80% of overall economic benefits that are set against capital and other costs in the cost-benefit analysis employed to help reach investment decisions.

Average travel time has been measured regularly in the National Travel Survey (NTS) and has barely changed over almost fifty years, at close to an hour a day for travel by all modes except international aviation. So, there is a paradox in that huge past investments in transport infrastructure have been justified by the expected value of travel time saved, which yet is not apparent in any change in travel time averaged across the population.

The explanation is that travel time savings are quite short run. In the long run, people take the benefit of faster travel to travel further, to gain access to more people and places, to have more opportunities and choices. Thus, while average travel time remained constant, the average distance travelled increased from 4500 miles a year in the early 1970s to around 7000 miles in the late 1990s. The economic benefits to users of transport infrastructure investment therefore are not time saved for more work or leisure, but rather relate to enhanced access to, and choice of, jobs, homes, schools, shops and other services.[1]

Such access is subject to diminishing returns. For instance, 80% of urban residents in Britain have access to three or more large supermarkets within 15 min drive, and 60% have access to four or more, a level of choice likely for most to remove the need to travel further for yet more choice[2]. On the other hand, access increases with the square of the speed of travel, since what is accessible is defined by the area of a circle whose radius is proportional to the speed of travel. The combination of access increasing with the square of travel speed yet subject to diminishing returns means that travel demand to achieve access saturates, that is, it ceases to grow.

Such demand saturation, also known as market maturity, is of course a standard feature of consumer markets generally and it is to be expected for daily travel. The finding of the NTS that the average distance travelled has not increased over the past twenty years is consistent with this expectation. So rather than planning for ever more transport infrastructure investment based on time savings, we should limit investment to meeting specific access deficiencies in what is generally a mature transport system. This points, for instance, towards investment in urban rail that can increase economic density and hence agglomeration benefits, as the National Infrastructure Commission has argued[3], rather than on inter-urban roads where the benefits are overstated, as the following case study illustrates.

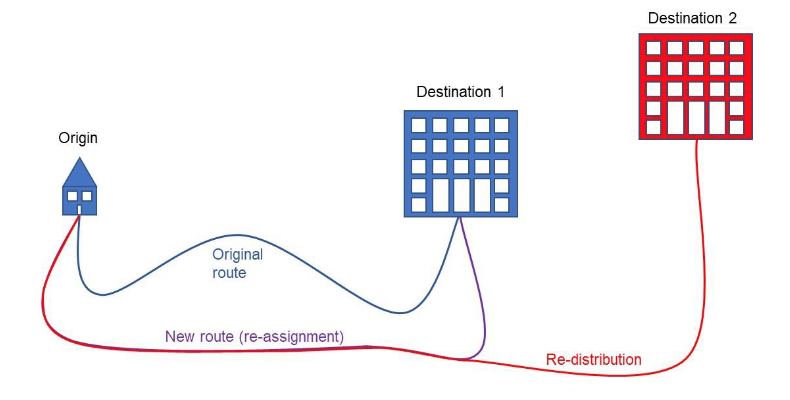
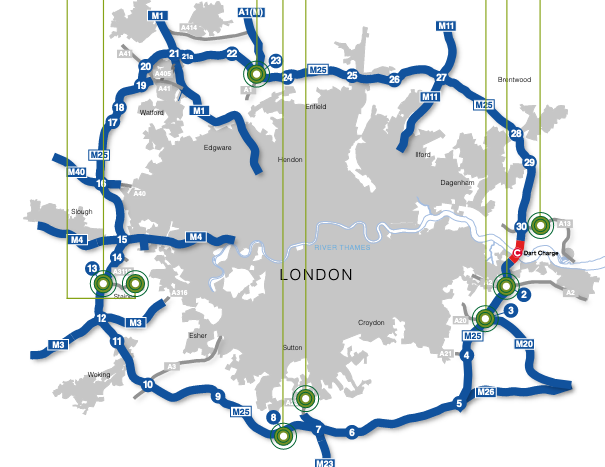
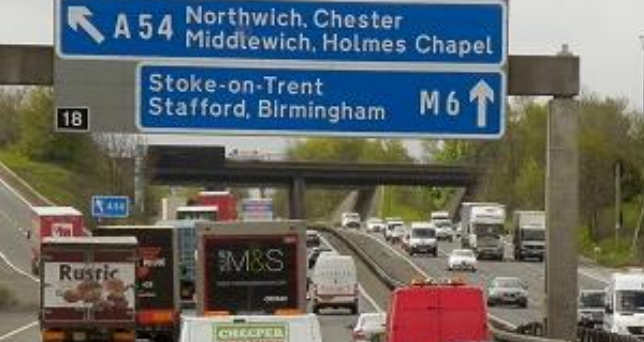
In 2015 the London orbital M25 was widened from three to four lanes in each direction between junctions 23 and 27, part of the so-called ‘Smart Motorway’ programme of Highways England, with detailed monitoring of traffic volumes and speeds before and for the first three years after opening. The growth of traffic was substantially greater than on major roads in the region and greater than forecast in the transport modelling used to justify the investment. The model predicted a significant increase in traffic speed, which generated travel time savings contributing to a benefit-cost ratio (BCR) of 2.9, which represented high value for money. However, beyond the first year, no increase in traffic speed was seen on account of the additional traffic. The evidence suggests that this is due mainly to local users rerouting between unchanged origins and destinations to take advantage of shorter journey times via the motorway, while incurring greater fuel costs. The outturn BCR must be quite small.[4]

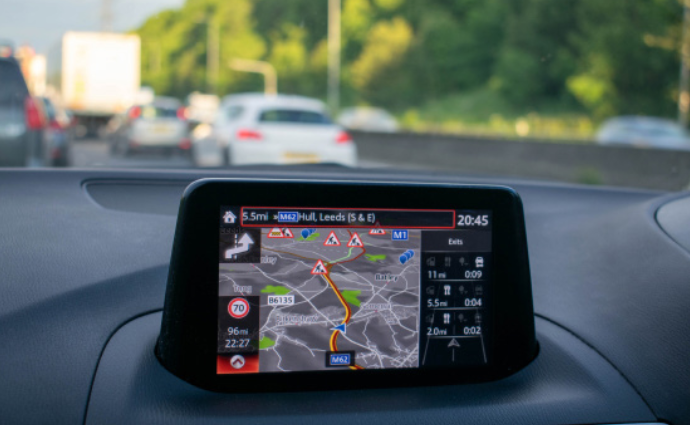
This M25 case is likely to be representative of much planned investment in new capacity on the Strategic Road Network, which comes under greatest stress in or near urban centres where local traffic competes for carriageway with the long-distance users for whose benefit the investment is primarily intended. Rerouting to take advantage of new capacity is facilitated by the widespread use digital navigation (satnav) devices that offer routes with the shortest time.

At present, optimism bias in modelling means that traffic growth is underestimated and time savings overestimated. Monitoring of traffic flows before and after opening is too crude a measure to understand the consequences of the investment for the different classes of road user. Accordingly, we need to monitor the changes in travel behaviour of a representative sample of users, employing the travel diary technique as used for the National Travel Survey. This would allow transport models to be better calibrated, such that changes in access could be identified and valued, and externalities (carbon emissions, pollutants etc) that are related to vehicle-miles travelled better estimated. In particular modelling needs to take account of the impact of digital navigation on traffic on the road network.

Built environment is changed

The focus on travel time savings in the standard approach to appraisal means that the impact of transport investment on the built environment is not properly taken into account. Consider a proposal to construct a bypass around a village, motived by concerns about the local environmental impact of traffic. The economic case would be based largely on the value of travel time savings from a faster route. However, a bypass may make land more accessible for development, for instance for housing, subject to decisions of the planners and the prospective return to developers. A bypass scheme with housing is clearly different from one without, as regards both traffic and economic benefit. The standard approach to appraisal disregards the benefit of new housing when estimating the BCR on the grounds that this would double count the user benefits, which might be shifted to others such as land owners but which would not change in overall magnitude. In reality, the impact of the scheme with housing is very different from that without and they need to be appraised separately.

More generally, the real-world outcomes of transport investments depend on decisions by planners and developer. It has been attractive for the DfT to operate in a silo, disregarding changes in land use, initially on grounds of simplicity that were perhaps justified in the heyday of motorway construction. But now that we have a mature network of transport infrastructure in place, with only fairly marginal increases feasible on account of the high cost of civil engineering work, we need to focus on the benefits of new schemes beyond the traditional user benefits. Decision-making needs to be tripartite, involving planners, developers and transport authorities.

The broad objectives of investment in transport infrastructure are threefold: to stimulate economic growth; accommodate population growth; and mitigate environmental harm. Accordingly, we need an approach to appraisal that helps reach investment decisions relevant to these objectives, or whatever more specific versions may be decided by those holding devolved budgets. Changes to the built environment need to be recognised explicitly since they are important to achieving objectives, whether to make sites accessible for new housing or for business expansion. Moreover, changes to the built environment are spatially located, whereas time savings are not, yet location of benefits is very relevant to investment decisions. For instance, the economic case for HS2 was based largely on benefits to users of the new route and was silent on spatial distribution, whereas the strategic objectives were concerned to rebalance the economy in favour of regions beyond London[5].

An innovative approach to decision-making has been developed by the National Infrastructure Commission for its recent assessment of rail needs for the Midlands and the North[6]. This focuses on the way in which improved rail services can increase the effective density of city centres, which has long been recognised as boosting the productivity of businesses from agglomeration benefits through more efficient labour markets, better supply chains and enhanced knowledge sharing. The Commission has extended this analysis to capture the consumption impacts of agglomeration through access to increased amenities, which replaces conventional time saving benefits. Separately, the Commission has developed a property value uplift tool that allows the estimation of the impact of transport investment on property prices[7].

Digital technologies

The widespread use of digital navigation was mentioned above. The other important new technology is the digital platform, used by ride-hailing businesses to match demand to supply, as exemplified by Uber. Much is known about the impact of ride-hailing on traffic in US cities because the authorities are able to require provision of data as a condition of the companies’ operating licence. This has prompted the companies to volunteer data provision to help cities address urban transportation needs.

In contrast to ride-hailing, the providers of digital navigation are secretive. Little is known about the algorithms that calculate routes in the light of prevailing congestion, and how the guidance to users affects traffic flows generally. It is noteworthy that the DfT has recently revised its road traffic statistics to generate an increase of 26% of motor vehicle traffic on minor roads over the past ten years[8]. It is likely that this has been due in large part to use of digital navigation that makes minor roads usable to those without local knowledge.

The lack of appreciation of the impact of digital navigation is remarkable, given its likely influence on the functioning of the road network. The DfT’s Road Investment Strategy 2: 2020-2025 makes no mention of the use of satnav (although there is an illustration of a device on p38). Highways England created a ‘high-tech corridor’ on the A2/M2 in Kent to trial digital communications between roadside infrastructure and vehicles, to improve journey time reliability, yet this appears to pay no regard to the general use of digital navigation. The prospects for investment in such a publicly funded guidance system look poor, given the benefits provided without charge by the private sector providers of digital navigation.

A better approach to taking advantage of digital navigation to improve the operation of the road network would be through regulation. There is in fact legislation in place, but never used, to licence providers of dynamic route guidance. Licence conditions could include the provision of traffic information to road authorities and the avoidance of use of unsuitable roads.[9] Guidance to users is provided without direct charge, hence accommodating such licence conditions should not affect the business models of the providers, which depend either on selling direction-finding to retailers’ websites or mapping services to vehicle manufacturers.

Conclusion

The standard DfT approach to appraisal is no longer suited to decisions on investments in a mature transport system. The standard methodology has become vastly elaborate and misses the point that the benefit of investment is better access, which is seen as changes to the built environment. Decision-making needs to involve planners and developers as well as transport authorities. The National Infrastructure Commission has developed alternative approaches that better reflect the reality. An independent review of appraisal methodology would now be desirable.

Digital navigation seems to be having a significant impact on traffic flows. While the consequences are as yet little understood, it appears likely that the modelled benefits of road investment would be overstated if local traffic rerouting is disregarded. It would be desirable for the DfT to commission a study of the impact of digital navigation on the road network.

January 2021


[1] Metz, D. (2021) Time constraints and travel behaviour. Transportation Planning and Technology,44 (published online).

[2] Competition Commission, The supply of groceries in the UK market investigation, 2008. Fig 3.9

[3] National Infrastructure Commission, National Infrastructure Assessment, 2018.

[4] Metz, D. (2021) Economic benefits of road widening: discrepancy between outturn and forecast. Transportation Research Part A, (forthcoming).

[5] Department for Transport. Full Business Case: High Speed 2 Phase One. 2020.

[6] National Infrastructure Commission. Rail Needs Assessment for the Midlands and the North: Final Report. 2020.

[7] https://nic.org.uk/studies-reports/national-infrastructure-assessment/uplift-tool/

[8] Department for Transport. Benchmarking Minor Road Traffic Flows for Great Britain, 2018 and 2019: Methodology Report. 2020.

[9] Road Traffic (Driver Licensing and Information Systems) Act 1989.

The Treasury is consulting on ‘VAT and the Sharing Economy’. This is prompted by concerns for a level playing field between traditional businesses and newer models made possible by the internet, and also about loss of tax revenue.

The innovative approach of Uber, and to a lesser extent other providers using digital platforms, has made a significant improvement to the quality of transport services. The market for taxis is competitive, involving black cabs driven by owner-drivers as well as ‘minicabs’ whose owner-drivers taking bookings via a local agent. There is no evidence of tendency to monopoly by the dominant digital platform. In general, no taxis charge VAT so that providers of taxi services via digital platforms have no competitive advantage.

Accordingly, charging VAT on taxi fares collected via a digital platform would distort competition, at least while the VAT threshold applies to owner-drivers. There may be a case for abolishing the threshold for all taxi services to achieve a level playing field, although this would be onerous for those drivers who work part time to supplement earnings from their main employment.

If the VAT threshold were retained for owner-drivers other than those operating through digital platforms, the platforms might seek to preserve their competitive position by absorbing the tax through taking more commission from the drivers, although that would be limited by the need to pay enough to recruit drivers. In this situation, drivers offering taxi services via digital platforms would be disadvantaged. Alternatively, were VAT not to be absorbed by the platforms, fares would be higher to the detriment of consumers, leading to the platforms likely exiting the market, again to the detriment of consumers.

More generally, public transport fares are zero rated for VAT, so levying VAT on taxis would distort the market for non-private travel.

In short, were VAT to be levied only on fares charged by taxi services provided via digital platforms, the existence of the VAT threshold would distort competition, to the detriment of consumers.

There are suggestions, unconfirmed, that HMRC has already raised a £1.5 billion VAT assessment on Uber.

Note added 22 February 2021: The recent judgement of the Supreme Court that Uber drivers must be treated as workers, not as self-employed, may increase the likelihood that Uber would be obliged to charge VAT on fares.

I have a new paper on how time constraints affect our travel behaviour. The link to the journal is here. Some copies are free to download here. The manuscript is here. The abstract is below.

Considerable observational evidence indicates that travel time, averaged across a population, is stable at about an hour a day. This implies both an upper and a lower bound to time that can be expended on travel. The upper bound explains the self-limiting nature of road traffic congestion, as well as the difficulty experienced in attempting mitigation: the prospect of delays deters some road users, who are attracted back following interventions aimed at relieving congestion. The lower bound implies that time savings cannot be the main economic benefit of transport investment, which means that conventional transport economic appraisal is misleading. In reality, the main benefit for users is increased access to desired destinations, made possible by faster travel, which is the origin of induced traffic. Access is subject to saturation, consistent with evidence of travel demand saturation. However, access is difficult to monetise for inclusion in cost-benefit analysis. Consequential uplift in real estate values may be a more practical way of estimating access benefits, which is relevant to the possibility of capturing part of such uplift to help fund transport investment that enhances such access.

The Department for Transport is consulting on whether to extend the length of the appraisal period used to assess project benefits, typically 60 years at present. The argument is that many projects have the potential to deliver benefits well beyond this time horizon, but these benefits are not currently included in scheme appraisals. My response is set out below.

The standard approach to the appraisal of transport investments is based on the estimation of user benefits, mainly the saving of travel time. Clearly, uncertainty increases as more distant future benefits are considered. Factors that would need to be taken into account in estimating future demand include:

  • Population growth. The Total Fertility Rate (the average number of children born to a woman over her lifetime) for the UK is 1.89, below the level of 2.1 needed for a stable population, and the lowest on record. Many developed countries have lower rates: Germany 1.45, Italy 1.44, Japan 1.41. So, we may experience future population decline, although decisions on immigration would affect the outcome.
  • The relationship between income growth and travel demand. The average distance travelled by all surface modes has not increased this century (NTS data), suggesting an uncoupling of the relationship between GDP growth, income and travel demand. There is evidence for the saturation of demand for daily travel.

More generally, it is impossible to validate the performance of models far into the future. Lack of validation contributes to optimism bias in modelling generally. Models are complex and opaque, with the value of many parameters to be chosen based on expert judgement, such that outcomes can often reflect the preconceptions of those who commission the modelling. The Green Book and TAG provide uplift factors for costs to allow for optimism, but there is no equivalent for benefits.

There is evidence for optimism bias in demand estimation, particularly when competitive bidding is involved, as for rail franchises in the UK and toll road concessions in Australia. Some winning bids have been too optimistic in projecting future revenues, such that rail franchisees have withdrawn, and toll road investors disappointed and consultants successfully sued.

Given all the uncertainties, extension of the appraisal period beyond the current duration would be unwise. The possibilities of benefits beyond 60 years might be regarded as a bonus that could increase confidence in an investment that offers an acceptable BCR within that period, as well as to counter optimism bias in demand estimation.

I imagine the interest in extending the appraisal period arises from the HS2 Business Case, where extending to 100 years generates a small increase to the BCR that is otherwise in a low value for money category. Notwithstanding the arguments above, there could be a case for extending the appraisal period for HS2 on account of the expected changes in land use.

There has always been an inconsistency in supposing time savings to be the main user benefit of transport investment, given that average travel time as measured in the NTS has hardly changed over almost fifty years, despite huge investment justified by the saving of travel time. The explanation is that time savings are short run. In the long run users take advantage of faster travel to travel further, to gain more access to people, places, opportunities and choices. Increased access leads to changes in land use and in the built environment that are mainly long term.

Accordingly, it could be appropriate to appraise the long-term benefits of transport investment as part of consideration of its long-term impact on the wider built environment. In the case of HS2, this would involve assessing the prospects for business and residential property development at locations whose access is enhanced by the new rail route. That is not to say that changes in land use would continue over a long period. They may well take place fairly quickly, both before and after the rail route opens, although there would be long-term benefits from the improvements to real estate. There are many uncertainties about such developments, both planning and commercial, but these uncertainties are directly relevant to policy objectives and therefore worth addressing, unlike the uncertainties about long run travel time savings.

The underlying question concerns the nature of the long run economic benefits of transport investment. While an extensive methodology has been developed based on time savings as the main part of generalised costs, time and money are importantly different. Time acts as an independent influence on travel behaviour. The long run impact of investment is to increase access within a time constraint. Such increased access is the benefit to users and results in changes to the use and value of land made more accessible.

In conclusion, if appraisal focuses on time savings to users, then extension of the appraisal period is not justified. If, however, the focus is on increasing access to the built environment, then a longer timeframe might be warranted.


The National Infrastructure Commission (NIC) has published its final report on Rail Needs Assessment for the Midlands and the North. This had been commissioned by the government to support its intention to prepare an Integrated Rail Plan to identify the most effective scoping, phasing and sequencing of relevant investments and how to integrate HS2, Northern Powerhouse Rail, Midlands Rail Hub and other proposed rail investments.

The projection of benefits departs from the standard transport cost-benefit analysis in which the main economic benefit to users is the saving of travel time. As set out in the annex to the report, the Commission’s approach is to assess the potential for rail investments to support both economic growth and improved quality of life, as these arise through the increase in density in city centres. Such density increase generates the well-known boost to productivity from agglomeration, an approach which is innovatively extended to capture the consumption impacts of agglomeration through access to increased amenities. The latter replaces conventional time saving benefits.

The NIC analysis recognises increased wages for workers accessing better paid jobs through increased rail capacity. Improvements in rail connectivity between cities and towns are also estimated, which contribute to increased productivity.While changes in life cycle carbon emissions and in natural capital are estimated, changes in land use are not.

The NIC’s methodology is used to compare packages of investment, formulated according to both overall cost and emphasis on enhancing links, regional and long distance. Broadly, investment in regional links comes out as a bit more attractive than in long distance links, which implies less importance to building the eastern leg of HS2 to improve journey times to London than in reinforcing connections within the regions. However, in relation to the cost of investment, none of this additional rail capacity seems very attractive, although the Commission concludes that with some assumptions about the non-monetised benefits, its analysis suggests the full benefits should meet or outweigh the costs of the packages. In this respect it is similar to the conventional economic analysis of HS2.

Assessment

The NIC analysis is particularly interesting in that it is based on the recognition that travel time savings are not a satisfactory basis for estimating the benefits of transport investment, given that average travel time has not changed for at least half a century despite huge investment justified by the expectation of time savings. So the NIC focuses on the benefits of increased density of city centres that could be made possible by better rail connections. The established estimation of productivity benefits arising from higher density, the agglomeration effect, is extended to amenity benefits to consumers, a welcome innovation. Nevertheless, valuation of agglomeration effects is indirect, depending on econometric analysis, as opposed to changes in land use and value that are directly observable. So the omission of changes in land use from the NIC analysis is a pity.

The Department for Transport recently published a document outlining its approach to updating its Transport Analysis Guidance (TAG) ‘during uncertain times’. Two factors imply reduced travel demand: the long-term assumption about GDP growth has been reduced from 1.9% pa to 1.4%; and population growth from 0.3% to 0.15%, reflecting exit from the EU. New values for carbon emissions are also to be provided.

What was missing, I thought, was consideration of the need to update modelling, given the DfT’s intention to published a transport decarbonisation plan. Yet there are a number of shortcomings to existing modelling techniques, particularly in respect of estimating the impact of interventions aimed at reducing transport carbon emissions.

National models

The National Transport Model (NTM) is used to generate the Road Traffic Forecasts, most recently published in 2018. Scenario 7 addresses the consequences of a shift to zero emission vehicles and projects a 51% increase in road traffic 2015-2050, compared with 35% for the reference case, reflecting a reduction in fuel costs and assuming no changes to government policy on taxation.

There are, of course, sensitivities about making assumptions about future taxation. Yet mode share is influenced by levels of tax and subsidy. Arguably, both the growing proportion of SUVs and the decline in bus use have been facilitated by the freezing of road fuel duty since 2011. There is therefore a need for an approach to modelling that allows the full range of policy options to be explored, including changes in relative costs. One possibility might be to seek a remit analogous to that given by HMT to the National Infrastructure Commission, which must be able to demonstrate that its recommendations are consistent with gross public investment in infrastructure of between 1.0% and 1.2% of GDP in each year between 2020 and 2050.

Taxation aside, the growth of traffic projected in Scenario 7 is implausible. Travel time has been measured in the National Travel Survey (NTS) for the past 45 years and on average has remained close to an hour a day. This implies that the time available for travel is constrained. A reduction in fuel costs therefore would not lead straightforwardly to an increase in distance travelled, which would only arise if either higher speeds were possible (not to be expected from a switch to zero emission technology) or higher car ownership occurred (not assumed in the model).

More generally, the three key parameters of the NTS – average travel time, trip rate and distanced travelled per year – have not increased since 2000. I would expect any model to hold these per capita parameters unchanged on a central case projection, unless there were to be a clear causal explanation for a different trend. Population growth is then the main determinant of future traffic growth, but the relative mode share would depend on where the additional inhabitants live: to the extent they are housed on greenfield sites, car use would be important; to the extent they are located within existing urban areas, investment to support active travel and public transport would be relevant. My understanding is that the National Trip End Model (NTEM) provides a single national set of assumptions about demographic factors, and therefore does not allow consideration of policy options in respect of spatial location. If public transport and active travel are to be ‘the natural first choice for daily activities’, then the spatial location implications of population growth need to be incorporated into modelling.

Regional models

Beneath the NTM, there are a number of regional transport models. Those commissioned by Highways England are mainly (entirely?) based on the SATURN software first developed in 1980. Despite very considerable ex ante efforts to refine and update such models, there is a dearth of ex post analysis of modelling validity. A partial exception is the detailed monitoring of traffic for each of the three years after opening of the widened M25 between J23 and J27. Small time savings were found at year one, but these were lost by year two due to increased traffic volumes. The forecast traffic volumes derived from the model were less than observed and the forecast increase in traffic speed did not materialise, hence negating the economic case for the investment. The additional traffic generated externalities beyond forecast, including carbon emissions.

More generally, the whole area of regional modelling lacks transparency. Highways England does not appear to publish information on its models and their validation. It would be timely to review the validity of such models.

Assessment

Current UK transport modelling as a whole seems mainly concerned to update, refine and apply long established approaches. The bulk of modelling expertise is found within the consultancies, who are concerned to meet the needs of their clients using accepted methodologies, often to provide formal justification for a preferred investment. The Department is conservative in its requirements. Consultants therefore have little incentive to develop innovative approaches. Fresh thinking is needed, yet there is no academic centre of expertise in transport modelling where innovation could be expected.

Established models do not seem well suited to supporting a strategy aimed at achieving net zero transport carbon emissions by 2050. A related problem is the lack of data for model calibration in respect of the impact of the range of possible policy interventions. For instance, if the encouragement of active travel is successful, from which mode does the shift occur? The experience of the cycling city of Copenhagen is that car use is only slightly less than in London, but public transport mode share is half that of London. This suggest that we can get people off the buses onto bikes, but that it is more difficult to get them out of their cars, even in a city where all motorists are familiar with cycling.

Decarbonisation will be a long game, during which we should be able to gain understanding of the consequences of the various policy interventions, even though these will be difficult to model at the outset. It would be desirable to initiate the development of new models soon, ready for when calibration data becomes available.

Lynn Sloman and colleagues of Transport for Quality of Life (TQL) issued a report about carbon emissions arising from the Department for Transport’s second Road Investment Strategy (RIS2). Their detailed analysis reaches the conclusion that the increase in CO2 from RIS2 would negate 80% of potential carbon savings from electric vehicles on the Strategic Road Network (SRN) between now and 2032.

This conclusion struck me as surprising. Although annual expenditure on new capital projects for the SRN has been running at over £2 billion a year, civil engineering is very costly and we don’t get much extra capacity for our money. The recent rate of addition of lane-miles to the SRN has been 0.5% a year, which is less than the rate of population growth. So how could such a low rate of addition of capacity have such a large adverse impact on carbon emissions? We need to question the TQL calculations.

TQL argues that the RIS2 road schemes will increase carbon emissions in a number of ways, particularly by increasing speeds and inducing more traffic, both of which they believe are underestimated in conventional scheme appraisal. They therefore estimate the additional cumulative carbon emissions from these sources, both put at around 6 Mt CO2 for the period 2020-2032. But I wonder if there is not some overstating here, given that more traffic would tend to reduce speeds. For instance, for a scheme to widen part of the M25, I found that outturn traffic flows were higher than forecast, such that there was no increase in traffic speed.

TQL estimate that RIS2 would increase carbon emissions by 20 Mt CO2 for the period 2020-2032, including carbon from construction. This is then compared with the difference in carbon emissions between two scenarios from the DfT Road Traffic Forecasts 2018, the Scenario 1 reference case and Scenario 7 high electric vehicle case, which amounts to a reduction of 25 Mt, hence the conclusion that the increased carbon emissions would negate 80% of the benefit of the shift to EVs.

There are, however, problems with this estimate of carbon reduction from EVs. Scenario 7 assumes no tax on EVs to replace fuel duty, so that the cost of motoring decreases substantially (by 60% by 2050), hence a projected large increase in traffic compared with Scenario 1 (50% increase by 2050 compared with 35% for the reference case). Whatever the realism of the assumption about tax, such a large increase in traffic is implausible as the consequence of electrification. Average travel time has remained constant at about an hour a day for the past 45 years at least, hence to travel further it would be necessary to travel faster, which will not happen through a change in propulsion. The problem is that the Road Traffic Forecasts derive from the National Transport Model, which does not recognise travel  time constraints.

An assumption that electrification has no effect on traffic volumes would substantially increase the scale of carbon reduction under Scenario 7, to which could be added the benefit of bringing forward the phase out of non-electric cars and vans earlier than 2040, as assumed in that Scenario. And if we reduce the additional carbon from the RIS2 programme to allow for some overstating, then we could arrive at a less pessimistic conclusion than the TQL authors about the carbon impact of this programme on future overall SRN emissions.

Nevertheless, despite these caveats, I agree with the conclusions of the TQL report that RIS2 is anachronistic, and that cancellation would free up substantial investment for better uses, not least fast broadband to lessen the need for travel, both for commuting and on business. The SRN is under greatest traffic stress in or near urban centres during the morning and late afternoon peaks, when car travel to and from work interferes with long distance road users. The economic case for road investment needs to be reconsidered in the light of changes in daily travel prompted by the pandemic.

The National Infrastructure Commission (NIC) has issued an interim report on its assessment of rail needs for the Midlands and the North. It sets out a methodology for appraising investment options. The aim is to assess the potential benefits of possible investment packages, focussing on what rail is good at compared to other modes: transporting people into dense city centres and providing high speed links between cities.

The NIC believes that existing approaches to assessing the impact of rail investments on economic growth, such as conventional cost benefit analysis, fail to fully capture the interactions between rail investments and other factors, such as skilled employment and urban development.

Specifically, the NIC notes that conventional cost-benefit analysis in transport starts from ‘user benefits’ such as journey time savings. Wider economic benefits from agglomeration can then be added provided care is taken to avoid double-counting. However, this approach has been criticised for commuter journeys, because assumptions made around time savings do not appear consistent with the empirical evidence on travel times (this is a reference to my longstanding observation of the invariance of average travel time). Instead, the intention is to assess the economic benefits of increased transport capacity that allows more people to travel into city centres, thus increasing the agglomeration benefits that arise from density.

This is a rather radical approach, which runs counter to half a century of conventional transport economic analysis, and which I welcome, as a long time critic of orthodoxy. I look forward to seeing how its works out in practice.

I previously noted publication by the Department for Transport of its Second Road Investment Strategy (RIS2). DfT has now issued an economic analysis that concludes that the new programme represents high value for money. I had hoped that this document would provide substantiation of the £27 billion, 5-year road investment programme but I was disappointed.

The summary states that overall RIS2 is High Value for Money, meaning £2 return for every £1 spent (Benefit-Cost Ratio of 2). Yet new commitments of major capital enhancement schemes yield a BCR of 1.5, which is unimpressive. The analysis is minimal, offering no breakdown into individual schemes, where some might be expected to have a BCR of 1 or less if the average is 1.5.

These estimates are based on the now rather dated Road Traffic Forecasts published in 2018, which included five distinct scenarios, yet no indication is given as to how the BCR would vary with scenario. The estimates are also derived from new but unpublished regional traffic models, asserted to be ‘world leading’.

I previously pointed out a major discrepancy between traffic forecasts and post-opening outturn for the smart motorway widening of the M25 between Junctions 23 and 27. These forecasts were generated by a regional model of the kind now in general use by Highways England, based on SATURN software that originated in the 1980s. The purpose of these models is to estimate travel time savings that arise from adding carriageway, which feed into an economic model. Yet in the M25 case, no time savings were observed beyond year 1 after opening, putting the validity of such models  in doubt.

The new DfT analysis frequently asserts that its analysis is robust (15 times, in fact), which is usually a sign of intellectual insecurity. In fact, the analysis is pretty thin and seems intended to justify a road construction programme developed in earlier era, before we have had a chance to assess the impact of the coronavirus pandemic and what this might mean for travel demand and for public expenditure priorities, urban vs. inter-urban transport vs. broadband.

The Department for Transport recently issued a report concluding that the Second Road Investment Strategy (RIS2) represents high value for money. One might have thought that this 29-page RIS2 Analysis Overview would porvide substantiation of the £27 billion, 5-year road investment programme announced earlier. We are disappointed.

The summary states that overall RIS2 is High Value for Money, meaning £2 return for every £1 spent (Benefit-Cost Ratio of 2). Yet new commitments of major capital enhancement schemes yield a BCR of 1.5, which is unimpressive. The analysis is minimal, offering no breakdown into individual schemes, where some might be expected to have a BCR of 1 or less if the average is 1.5.

These estimates are based on the now rather dated Road Traffic Forecasts published in 2018, which included five distinct scenarios, yet no indication is given as to how the BCR would vary with scenario. The estimates are also derived from new but unpublished regional traffic models, asserted to be ‘world leading’.

I previously drew attention to a major discrepancy between traffic forecasts and post-opening outturn for the smart motorway widening of the M25 between Junctions 23 and 27. These forecasts were generated by a regional model of the kind now in general use by Highways England, based on SATURN software that originated in the 1980s. The purpose of these models is to estimate travel time savings that arise from adding carriageway, which feed into an economic model. Yet in the M25 case, no time savings were observed beyond year 1 after opening, putting the validity of such models  in doubt.

The DfT report frequently asserts that its analysis is robust (15 times, in fact), which is usually a sign of intellectual insecurity. In fact, the analysis is pretty thin and seems intended to justify a road construction programme developed in earlier era, before we have had a chance to assess the impact of the coronavirus pandemic and what this might mean for travel demand and for public expenditure priorities, urban vs. inter-urban transport vs. broadband.