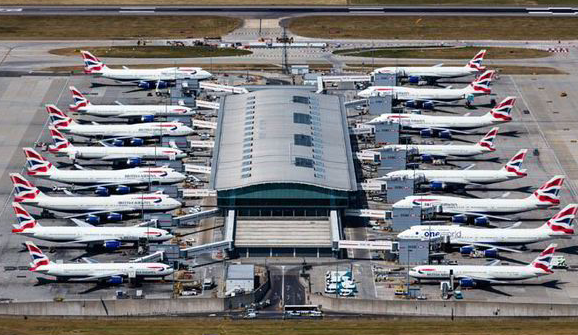
2015 marks the 50th anniversary of the first data collection of the British National Travel Survey (NTS). The Transport Statistics Users Group and the Department for Transport held a meeting on 23 September at which I was one of the speakers. My presentation is available Metz tsug 23-9-15 . This article outlines what I said about daily travel. A future article will deal with air travel.
Slide 2 of my presentation shows the main NTS time series, continuous over 40 years (the first data collection 50 years ago was a one off). This covers all modes except international air travel and is derived from 7-day travel diaries, hence covers daily travel. Journey frequency has remained broadly at about 1000 trips a year on average over the period, and average travel time has held steady at around 370 hours a year, or an hour a day. What has changed is the average distance travelled, which rose from 4500 miles in the early 1970s to reach 7000 miles in the mid 1990s, with no further growth in the past 20 years.
The growth in distance travelled, in the unchanged amount of travel time, is the result of investment in the transport system – private investment in more and better cars, and public investment in infrastructure. People have chosen to take advantage of faster travel to reach more distant destinations, not to save time going to previous destinations, to take advantage of increased opportunities and choices. For instance, by travelling faster on the journey to work, you have more choice of jobs accessible from where you live in the time you allow yourself for the commute, and more choice of homes accessible from your workplace; and similarly fast travel allows more choice of shops, schools and so forth.
Benefits of transport investment
Transport economists suppose that the main economic benefit of transport investments takes the form of journey time savings, which are valued because this permits more productive work to be carried out or more valued leisure to be enjoyed. However, the constant average travel time found in the NTS is evidence that there are no such time savings in the long run. So time savings must be short run, succeeded by changed travel behaviour as people choose more distant destinations. This means that we are appraising the value of long lived infrastructure investment based on short run time savings, which is not sensible.
We should ask what is the long run benefit from transport investment. This can be seen in East London, Docklands and beyond, which is being regenerated through rail investment – Docklands Light Railway (Slide 3), Jubilee Line Extension, Overground, with Crossrail under construction. Public investment in the rail system makes land accessible for development by private sector developers who construct residential and commercial property, which accommodates London’s growing population, both homes and employment. This is both the strategic narrative and the causal mechanism whereby transport investment facilitates economic growth. It is not sensible to value these rail investments on the basis of notional short run time savings. The real value is seen, for instance, in the high rents paid for office accommodation at Canary Wharf, reflecting both the access made possible by rail investment and the high value of the economic activity carried out there.
Strategic Road Network
Constant average travel time also provides an illuminating perspective on investment in the Strategic Road Network, shown in Slide 4 where the colour coding indicates the degree of congestion, from black through red and amber to green. In general, congestion occurs near to population centres, where local traffic impedes long distance users. On the M25 around London, for example, about half the traffic is long distance and half is local, importantly people going to and from work, which generates morning and evening peak congestion. Such congestion is seen by the Department for Transport and its roads agency, now known as Highways England, as a reason to increase capacity by adding carriageway. Evaluations of completed major schemes of improvement on the Strategic Road Network show average time savings at peak hours to be about 3 minutes per vehicle. Multiplying a few minutes by a large number of vehicles and by the standard monetary values of time yield economic benefits sufficient to justify the large investment in expensive civil engineering works. This is an example of justifying investment in long lived infrastructure on the basis of short run time savings.
But what happens in the long run? Faster travel resulting from widening the road is to the advantage of local users who can exercise more choice of jobs and homes, when they come to change these, by travelling further in the same amount of time. This generates extra traffic – known as ‘induced traffic’ – which restores congestion to its former level, so that long distance road users are no better off. This is the basis for the maxim ‘You can’t build your way out of congestion’, something that UK Transport ministers used to say when they didn’t have a big budget for roads investment.
What investment in the road network achieves is improved access that facilitates local development. This may be inadvertent as a consequence of misconceived efforts to tackle congestion. Or it may be intentional in support of local plans agreed between developers and planning authorities. However, it is difficult to devise a national road investment strategy on the basis of such local needs.
If we can’t build our way out of congestion, how can we tackle this challenge? Surveys of road users indicate that the main problem with congestion is the uncertainty of journey time. To deal with this we need to provide road users with good predictive journey time information before they set out, so they can plan their trips to arrive on time. This is increasingly possible as the digital technologies get faster, cheaper and more powerful. Digital technologies are very likely to be far more cost-effective than civil engineering in improving the performance of the road network.
Peak or Plateau
Returning to Slide 2, we see no growth over the past 20 years. About three-quarters of the 7000 or so miles travelled each year on average is by car, so it is no surprise that car use per capita has also changed little over this period (Slide 5). This is found not just for Britain but for the developed countries generally, and is known as ‘Peak Car’, although ‘Plateau Car’ might be a better term since, while it is clear that cessation of growth of car use started well before the recession, it is not certain that long term decline has set in.
Since per capita travel by all modes has stabilised, future total travel demand will be driven mainly by population growth, which in Britain is significant. But the pattern of demand growth will depend on where the additional inhabitants will live. If they are to be housed on greenfield sites, they would use cars and the road system would need to be enlarged. If, however, they are housed in existing urban areas where the scope for additional road capacity is limited, then public transport investment would be important.
Peak Car in London
London is an example of a city with a rapidly growing population with no greenfield sites suitable for house building, so that the brownfield sites and infill are being developed, and people are living at higher densities in existing properties. Slide 6 shows how London’s population grew until 1940, followed by a 50 year period of decline as people left a damaged, overcrowded city to seek a better quality of life in new towns, garden cities and the like. But around 1990 the tide turned as people saw again the attraction of city living, with numbers now projected to reach 11.3m by 2050.
While London’s population has been growing for the past 25 years, car traffic and car use has not (Slide 7). This is because of road capacity constraints. Having begun to build elevated motorways in the 1960s to accommodate growth of cars, this approach was abandoned in the face of popular resistance to the damage created in the urban environment. The historic street network has been retained, but with reduced capacity for vehicles on account of bus and cycle lanes, more pedestrian space, as well as parking controls in the inner boroughs and the congestion charging zone in the centre.
If the population of London is growing but car use is not, it follows that the share of journeys by car must be falling, as seen in Slide 8. Car use (driver and passenger) has fallen from 50 per cent of all trips in 1993 to 37 per cent currently. Walking plus cycling has changed little (cycling is growing, but from a low base), while bus and rail have increased, the result of substantial investment.
In Slide 9 the car share of trips in London is extrapolated to cover the century 1950-2050. Data prior to 1993 are based on the assumption that car use in London grew at the same rate as car ownership nationally, which we know from vehicle registrations. Future data is based on the assumption that London’s road capacity will not be increased but that rail investment will continue, in line with the policies of the Mayor and Transport for London. On this basis, the share of journeys by car will decline to about 27 per cent by 2050, despite which (or perhaps because of which) London is very likely to continue to thrive economically, culturally and socially.
The peak seen in Slide 9 I designate as ‘Peak Car in the Big City”. This shift away from car use in successful cities, as exemplified by London, together with the cessation of car use per capita nationally, are helpful in mitigating transport greenhouse gas emissions, as I previously described. The peak marks a transition: from an era in which the growth of travel demand was driven by increasing income to an era in which it is driven by population growth; and from the twentieth century in which increasing prosperity was associated with increasing car ownership to the twenty-first century in which increasing prosperity is associated with decreasing car use in successful cities (and static car use per capita beyond).
It is hardly possible to forecast a peak of the kind seen in Slide 9. A transport planner in London in the 1980s, thinking about the future, would see a 40 year trend in population decline, a 40 year trend in growth of car use, and would extrapolate both in to the future, as would a transport model. What the planner and the model would fail to foresee is the change in the economic structure of London and changed attitudes to urban living and car use. Models assume continuity between past and future, relying on historic relationships (elasticities and the like) to predict the impact of change in exogenous factors such as income and population growth, oil prices, and technological developments. However, the peak phenomenon implies a break in continuity and the need for forward-looking relationships. This is difficult for modellers to cope with since the bulk of the data they have for model calibration is historic.
The peak of car use in London occurred in 1990, 25 years ago, yet the modellers at the Department for Transport responsible for the National Transport Model still do not recognise this – they are in denial about Peak Car. In consequence this Model projects big increases in car traffic in London – depending on the scenario of up to 37 per cent by 2040 in the most recent Road Traffic Forecasts. This is hard to reconcile with the historic trend (Slide 7) and the plans of the Mayor, which do not involve increasing road capacity. The Model is not consistent with observed behaviour in London, nor with the evidence we have for other big cities.
Assessment
To think about the future, we would best focus on the invariant average travel time (Slides 2 and 10). The hour a day has hardly changed in 40 years, and probably for a lot longer, and is found in all other countries. The scope for increase is limited by the 24 hours of the day and all the other activities we need to undertake; and for decrease by the activities we need to reach beyond the home, as well as by the need to get out and about regardless of destination. So it would be sensible to constrain all transport models to hold average travel time constant in the long run. This would change model outputs when used to analyse the impact of a proposed investment, comparing the ‘do something’ with the ‘do minimum’ cases. Rather than time savings, the output would be changed access, land use and land value, which would be appropriate when the purpose of the investment is to stimulate economic growth – comprising population growth and productivity growth, both of which involve land use change.
My conclusions as regards daily travel are summarised in Slide 20. The NTS provides clear evidence that there are no travel time savings in the long run, and that there has been no increase in per capita travel for 20 years, the basis of the Peak Car phenomenon. The current theoretical frameworks for investment appraisal and forecasting are inconsistent with this evidence and hence need to be rethought. Using an economic framework inconsistent with the evidence results in sub-optimal investment decisions.
I see three problem areas. In my view we are investing too little in urban rail because we do not recognise the economic benefits associated with changed land use. Urban rail allows successful cities to grow to higher densities, which results in agglomeration benefits – economic, cultural and social – and which also mitigate greenhouse gas emissions. We are investing too much in civil engineering works on inter-urban roads in the futile hope of reducing congestion, although there is scope for supporting development where planners and developers wish to develop sites that require improved road access. And we are investing too little in the digital technologies that are likely to be far more cost-effective than the expensive civil engineering technologies in dealing with congestion. What we need here is to put monetary values on journey time reliability and to understand the response of road users to predictive information about journey time, as a basis for investment appraisal of digital approaches.